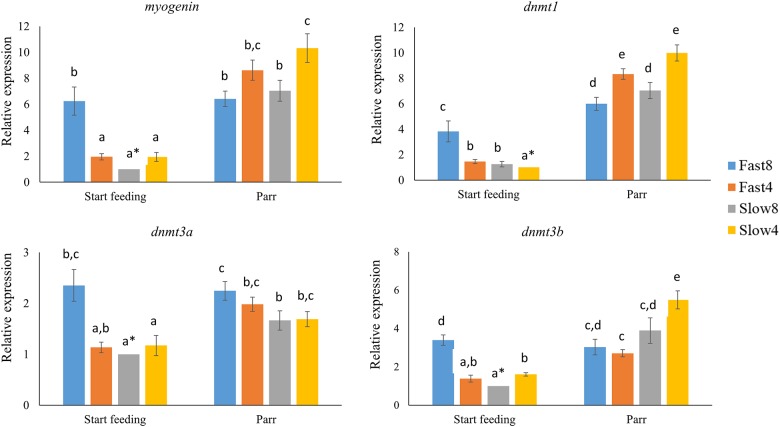
Fig 3. Gene expression of myogenin and DNA methyltransferases.
Relative expression of myogenin and the DNA methyltransferases dnmt1, dnmt3a and dnmt3b in start feeding larvae and in parr from families with Fast and Slow genotypes after incubation at 4°C or 8°C until the eyed stage. Asterisks represent the calibrator group with the lowest expression value set to 1 for the gene expression analysis. Different letters indicate significant differences between groups and stages (p<0.05).

