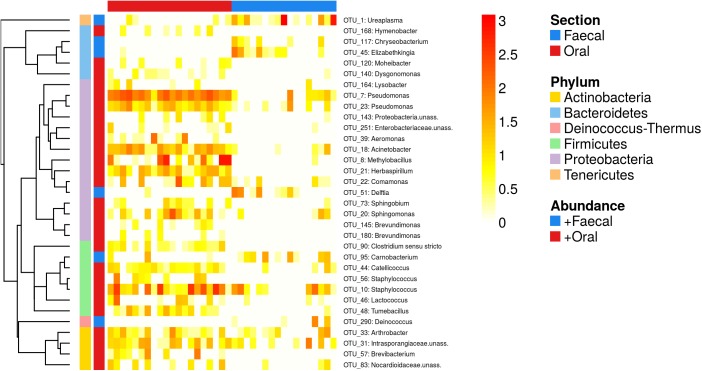
Fig 4. Heatmap for OTUs, whose abundance varied between the oral and faecal microbiota of the great tit.
OTUs were identified according to permutations-based LMEs. Cell colours indicate OTU abundances in individual samples (log10 scaled values). Column annotations indicate GIT regions, whereas row annotations show Phylum-level assignations and if the OTU was overrepresented in oral or faecal samples (+oral or +faecal). OTUs are ordered according to their phylogeny (i.e. FastTree-based phylogeny for representative sequences).

