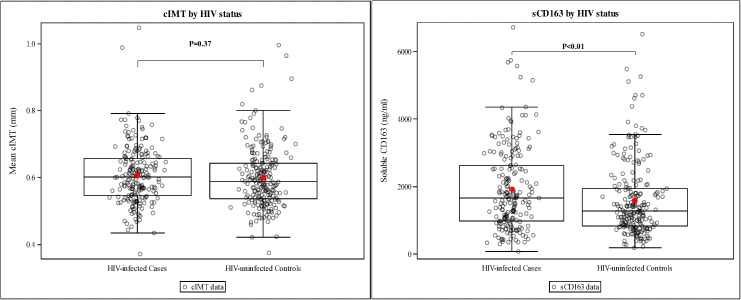
Fig 1. Carotid intima media thickness and sCD163 among HIV-infected patients and HIV-uninfected controls.
The horizontal bars of the whiskers represent the 10th and 90th percentile while the upper and lower boundaries of the boxes represent the first and third quartiles. The dots on either side of the box-plot represent the lower and upper extremes of the data.

