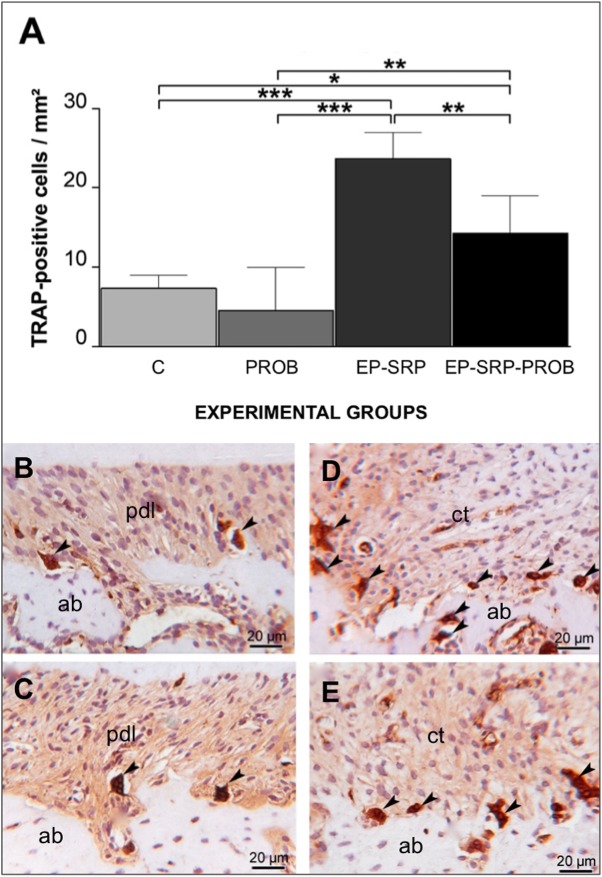
Fig 3. Immunohistochemical analyses–TRAP.
Means and standard deviations of the number of TRAP-positive multinucleated cells (A), with comparisons among groups. Photomicrographs demonstrating immunolabeling for TRAP (B-E) in the furcation regions of mandibular first molars: Group C (B); Group PROB (C); Group EP-SRP (D); Group EP-SRP-PROB (E). Abbreviations and symbols: ab = alveolar bone; ct = connective tissue; pdl = periodontal ligament; black arrowhead = TRAP-positive multinucleated cell; * = p<0.05; ** = p<0.01; *** = p<0.001. Scale bars: B-E = 20 μm. (Hematoxylin counterstaining).

