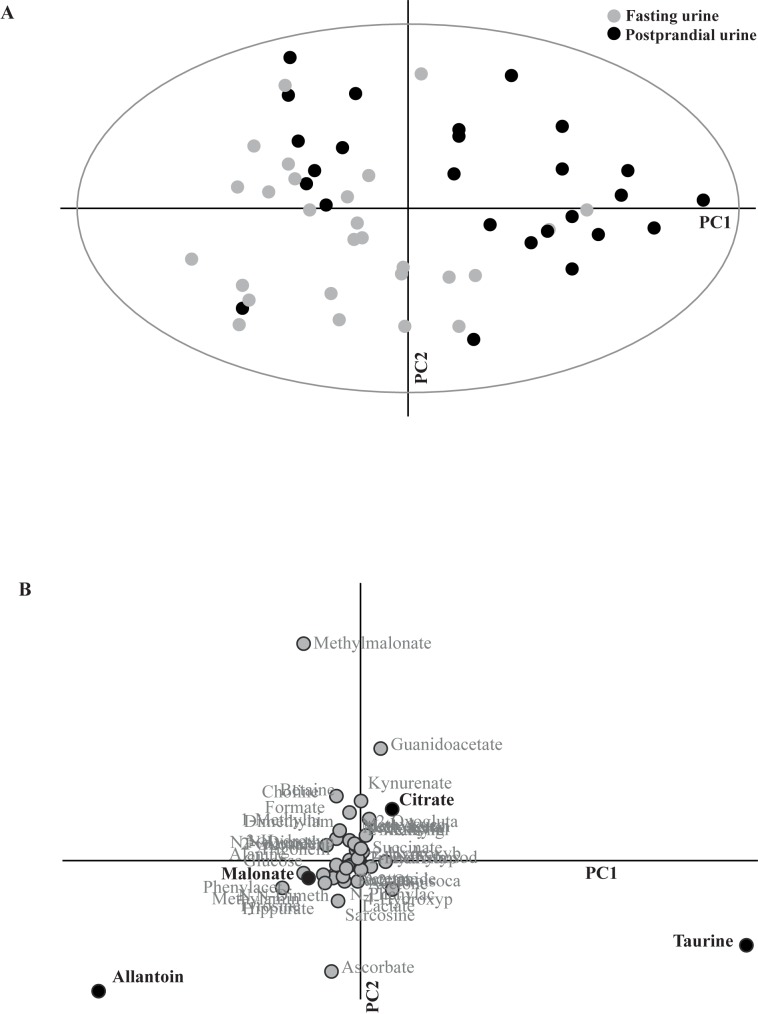
Fig 1. Principal component analysis between fasting and postprandial time points.
Fasting and postprandial urine samples showed a clear separation in principal component analysis (A). All 45 metabolites and all 28 dogs were included in this unconstrained model. Principal component (PC) 1 explained 12% of the variance and PC2 7%. The separation proved significant in a partial least-squares discriminant analysis (PLS-DA) model (for P-values, see Results section) where fasting and postprandial urine samplings were pre-defined as two separate groups. Loading plot (B) corresponds to the principal component analysis (A). Discriminative metabolites making a significant contribution to the separation between fasting and postprandial urine in the PLS-DA model (allantoin, taurine, citrate and malonate) are highlighted in bold text and with black dots.

