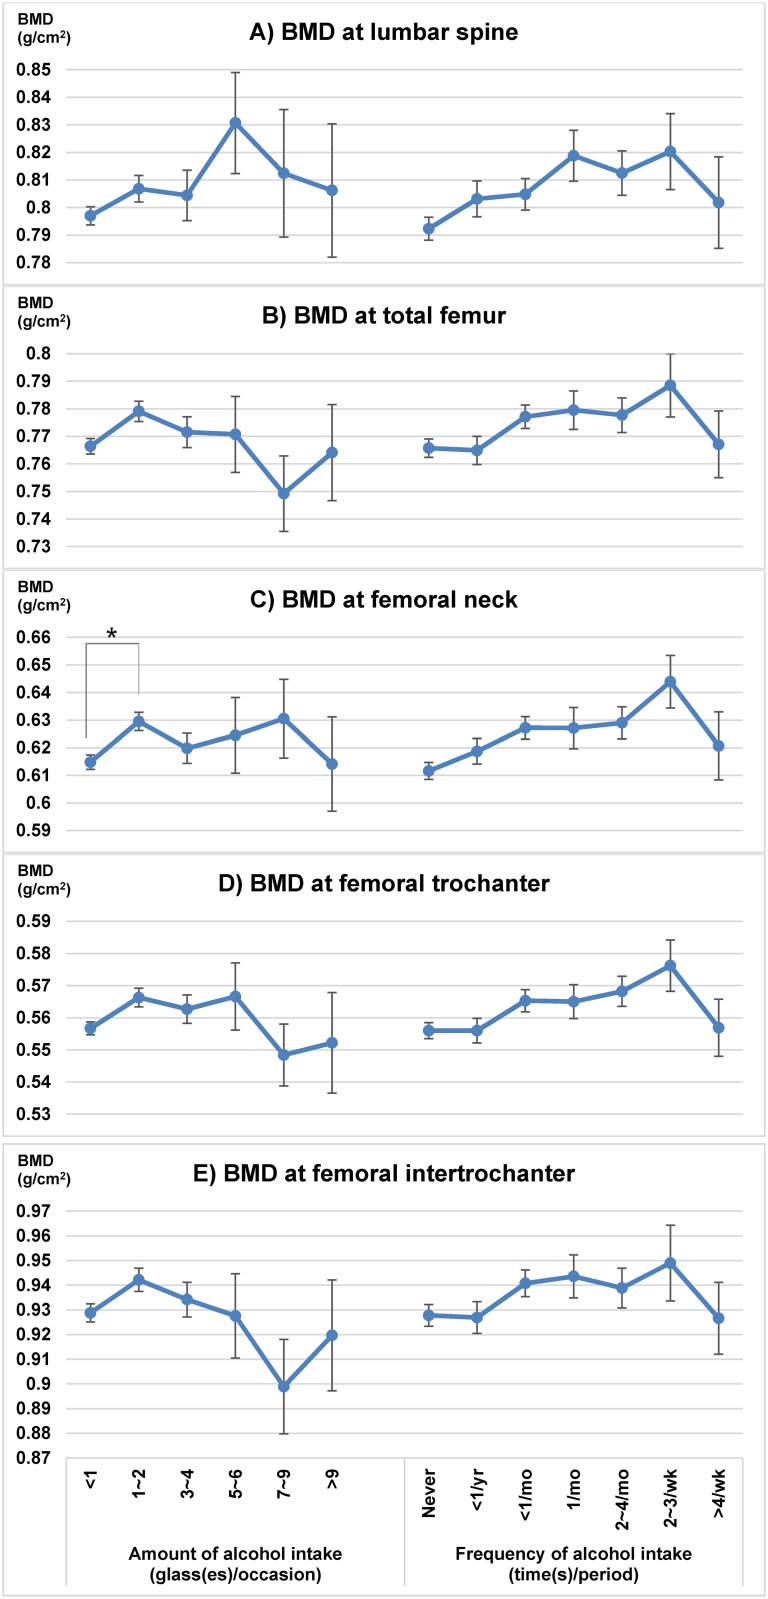
Fig 2. Mean BMD comparisons according to alcohol consumption.
Relationship between alcohol consumption and (A) BMD at lumbar spine (B) BMD at total femur (C) BMD at femoral neck (D) BMD at femoral trochanter (E) BMD at femoral intertrochanter. Statistical significance * p <0.05. BMD: bone mineral density; yr: year; mo: month; wk: week.

