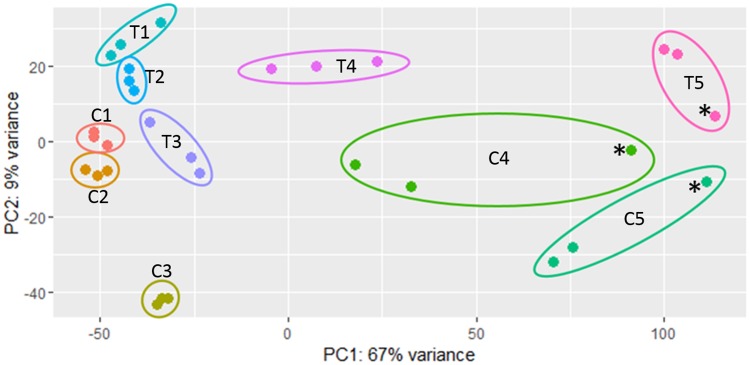
Fig 2. Principle component analysis plot of RNA sequencing biological replicates.
C1 through C5 refer to the L. monocytogenes control cultures grown at 20°C, and T1 through T5 represent the treated cultures grown at 4°C (see Fig 1 for information about the sampling points). Samples marked with * were excluded from our analyses due to an abundance of outlier data points.

