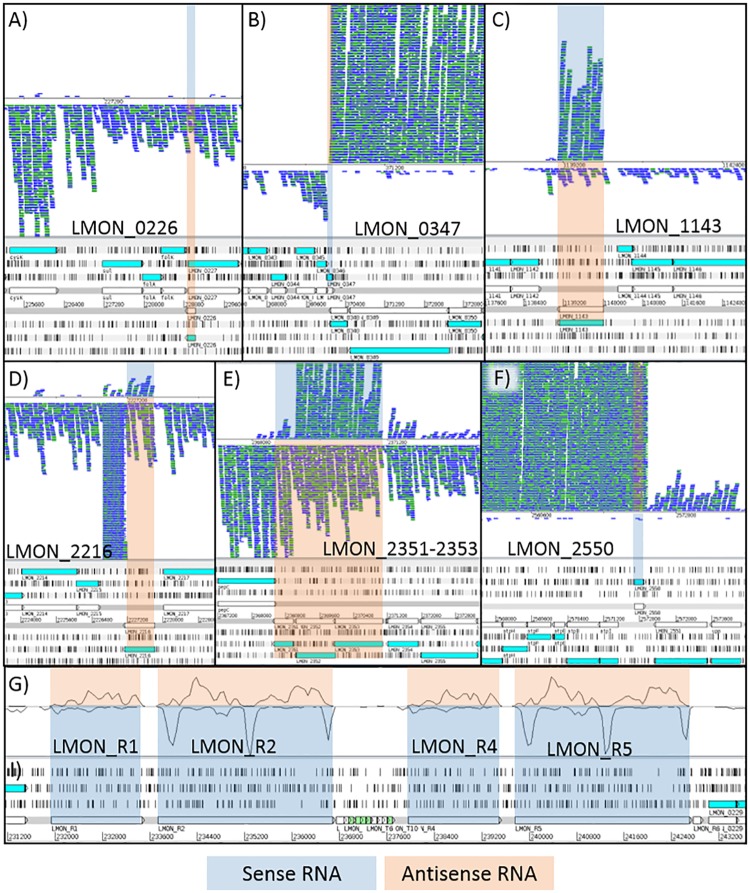
Fig 9. Coverage maps of select highly expressed antisense transcripts in L. monocytogenes cells grown at 20 or 4°C (refer to Table 6).
The coverage maps shown are from stationary phase cultures grown at 4°C. Panels A-F shows individual paired-end, reads while panel G shows overall coverage trends for rRNA (5, 16, and 23S). Reads with the same start and end alignment positions are overlaid and depicted in green. Areas shaded in blue and orange denote sense and antisense transcripts of target genes, respectively.

