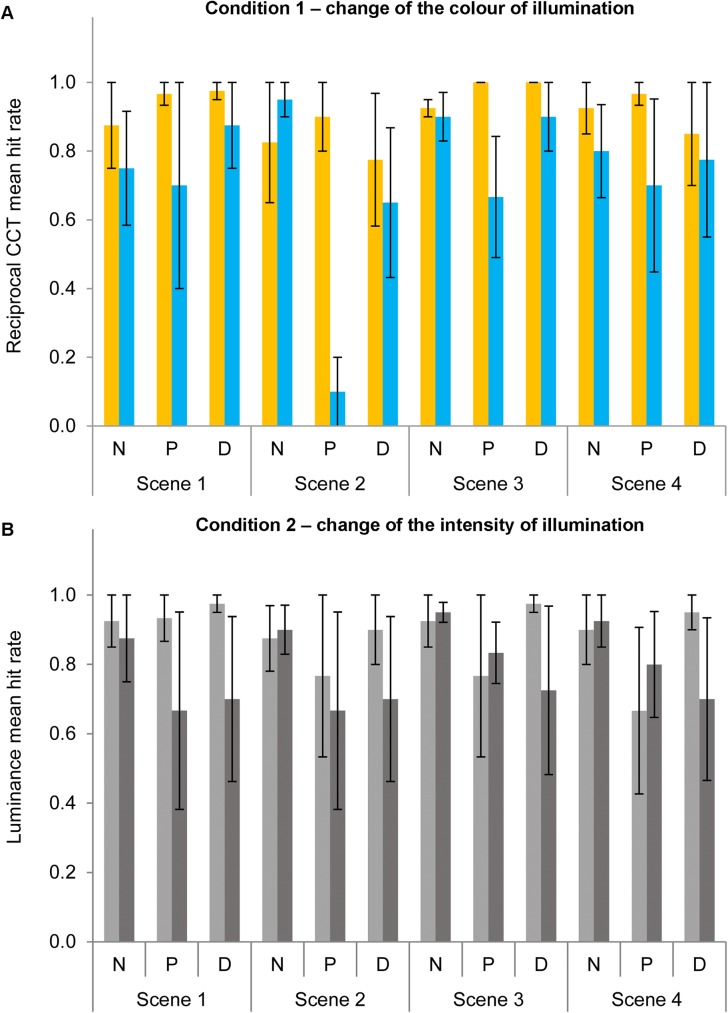
Fig 9. Mean hit rates for the four scenes in experiment 2.
Mean reciprocal CCT (Fig 9A) or luminance (Fig 9B) change identification hit rate towards higher (yellow bars in 9A; light grey bars in 9B) or lower (blue bars in 9A; dark grey bars in 9B) values for normal observers (N), protanopes (P) or deuteranopes (D) for the four scenes (see x-axis). Error bars show SEM. The lack of an error bar in some conditions/groups is due to lack of variability in the data.

