FIGURE 1:
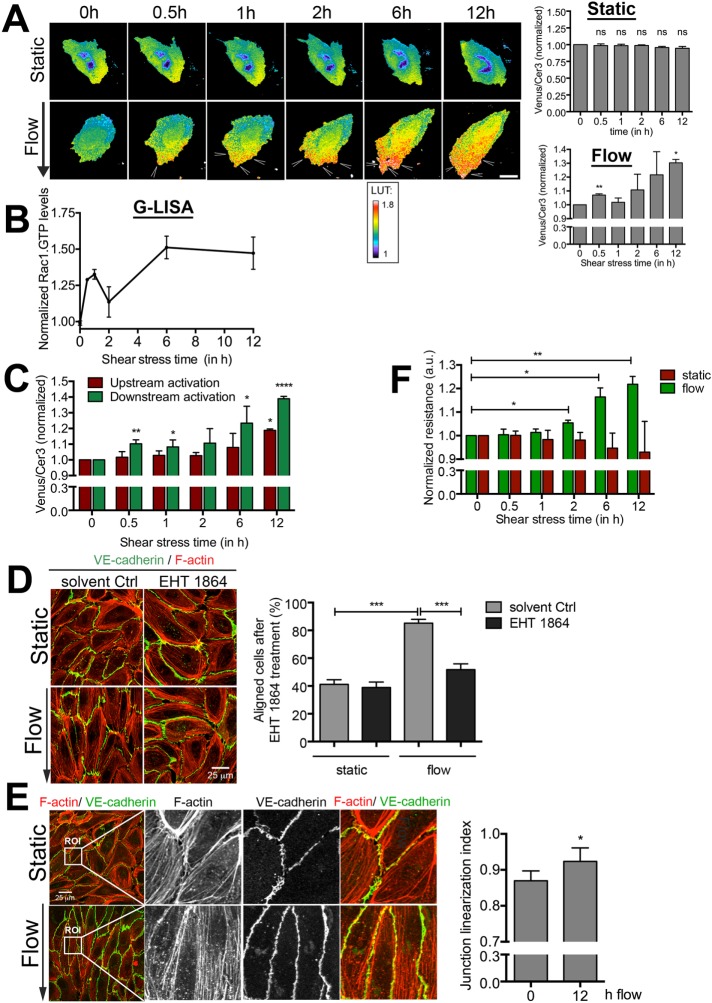
Active Rac1 is required for flow-induced alignment. (A) Left, time-lapse Venus/Cer3 ratio images of the Rac1 DORA biosensor simultaneously recorded with an epifluorescence microscope, showing spatiotemporal Rac1 activation under static conditions or upon flow (arrowheads; total 12 h; arrow shows direction of flow; flow speed, 10 dynes/cm2). Direction of flow is from top to bottom. Bar, 25 μm. Calibration bar (LUT) shows Rac1 activation (red) relative to basal Rac1 activity (blue). Right, activation ratio of the Rac1 biosensor in time. Top, static conditions; bottom, flow conditions. Data are mean of three independent experiments ± SEM. Significance compared with 0 h. *p < 0.05, **p < 0.01. (B) Rac1 activity measured with G-LISA at different shear stress times (30 min and 1, 2, 6, and 12 h). *p < 0.05. (C) FRET ratio measured in upstream (red) and downstream (green) sides of the cell upon the induction of flow. Rac1 activity was particularly detected at the downstream side. Data are mean of three independent experiments ± SEM. Significance compared with 0 h. *p < 0.05; **p < 0.01; ****p < 0.001. (D) Left, inhibition of Rac1 activity by EHT 1864 blocks alignment under flow, whereas solvent control-treated ECs are aligned in the direction of flow. Note that the inhibitor was present throughout the experiment due to the closed system used for long-term flow experiments. Right, percentage of aligned cells under static and flow conditions for both EHT 1864–treated and solvent-treated Ctrl ECs. ECs orientated with a 0–45° angle are quantified as being aligned. Data are mean of three independent experiments ± SEM. ***p < 0.001. Bar, 25 μm. (E) Left, long-term flow results in linearized VE-cadherin–based cell–cell junctions. F-actin in red and VE-cadherin in green. ROI, region of interest. Bar, 25 μm. Right, junction linearization index. Per experiment, three fields of view were quantified for junction linearization after 12 h of 10 dynes/cm2 compared with 12 h of static conditions. Data are mean of three independent experiments ± SEM. *p < 0.05. (F) Resistance measurements using ECIS under long-term flow conditions show an increase in monolayer integrity under long-term flow conditions (10 dynes/cm2; green), whereas the resistance did not change under static (red) conditions. Data are mean of three independent experiments ± SEM. *p < 0.05.

