FIGURE 10:

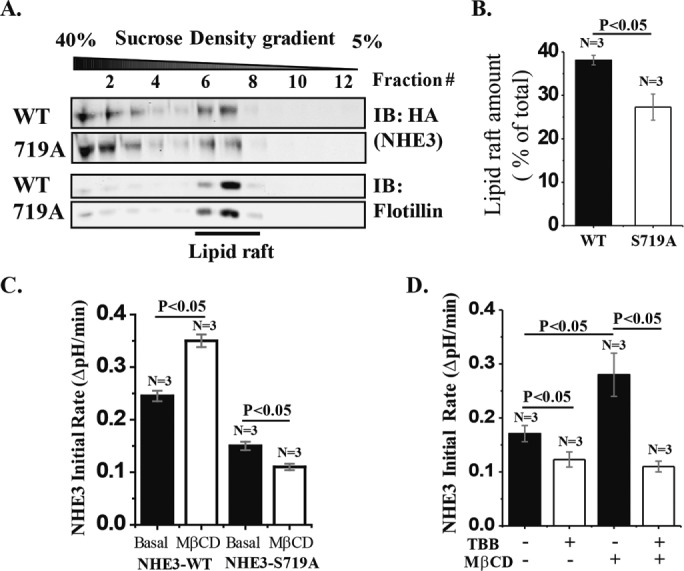
The lipid raft distribution of NHE3-S719A is reduced compared with WT-NHE3. (A) Total membrane preparations from Caco-2/bbe cells infected with Ad-HA-NHE3-WT or -S719A were subjected to lipid raft flotation analysis by sucrose gradient centrifugation. NHE3 was probed with HA mAb, and flotillin antibody was used as a lipid raft marker. NHE3 present at the low-density area overlapping with flotillin was considered as present in lipid rafts. (B) Percentage of NHE3 in lipid rafts calculated as total NHE3 intensity of the lipid raft component of NHE3 divided by total NHE3 intensity (lipid raft and nonlipid raft). Compared to NHE3-WT, S719A mutant was distributed ∼30% less in lipid rafts. (C) MβCD treatment (10 mM for 30 min) stimulated NHE3-WT activity (p < 0.05) but inhibited NHE3-S719A (p < 0.05). (D) MβCD stimulation of NHE3 activity in NHE3-WT cells was completely prevented by prior TBB treatment (p < 0.05). n, number of experiments. p values by paired t tests and ANOVA.
