FIGURE 2:
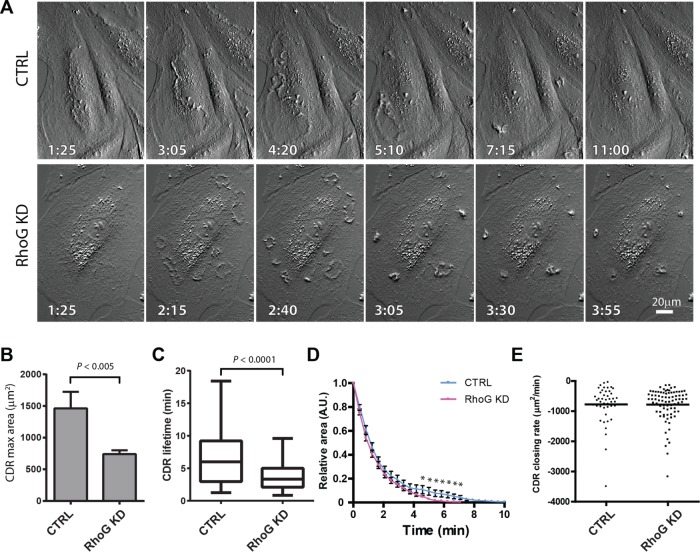
Dynamics of CDR formation in live cells. A7r5 cells transfected with siRNA targeting RhoG (RhoG KD) or with a nontargeting siRNA (CTRL) were analyzed by time-lapse microscopy immediately after the addition of 20 ng/ml PDFG-BB. Pictures were taken at intervals of 35 s, and CDR properties were evaluated using ImageJ. (A) A representative series for CTRL and RhoG KD after formation and disassembly of CDRs. Scale bar, 20 μm. (B) Average maximal area that each CDR reached during the total time recorded. (C) Average CDR lifetime. (D) Maximum area of each CDR was standardized to 1, and CDR disassembly was then plotted vs. time. Complete disassembly is achieved significantly faster in average CTRL cells than with RhoG KD (*p < 0.0001) but with similar kinetics. Results for A–C are expressed as mean ± SEM from two independent experiments (a combined total of 72 cells were analyzed in CTRL, and 82 cells were analyzed in RhoG KD). (E) For each CDR, the disassembly rate was calculated from the slope of a linear regression calculated for each CDR disassembly event. The difference between these two sets of data is not significant.

