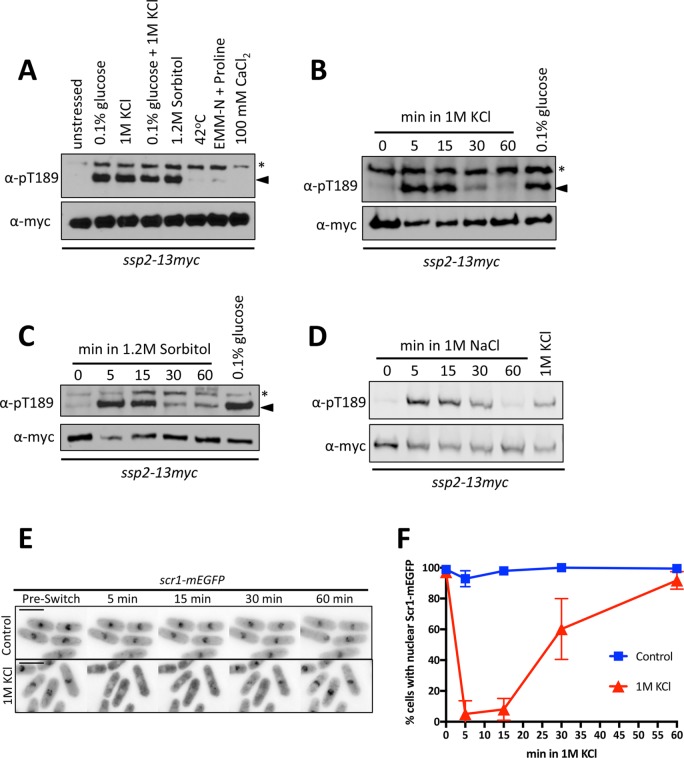
FIGURE 1:
Transient activation of Ssp2 by hyperosmotic stress. (A) Western blot showing levels of Ssp2-pT189 in response to the indicated environmental stresses. Treatments were for 15 min. We used α-myc as a loading control for total Ssp2. For α-Ssp2-pT189, asterisks denote background bands, and arrowheads mark the Ssp2-pT189 band. (B) Western blot showing activation kinetics of Ssp2-pT189 in response to 1 M KCl. We used 0.1% glucose treatment as a control for Ssp2-pT189 induction and α-myc as a loading control for total Ssp2. (C) Western blot showing activation kinetics of Ssp2-pT189 in response to 1.2 M sorbitol. We used 0.1% glucose treatment as a control for Ssp2-pT189 induction and α-myc as a loading control for total Ssp2. (D) Western blot showing activation kinetics of Ssp2-pT189 in response to 1 M NaCl. We used 1 M KCl treatment as a control for Ssp2-pT189 induction and α-myc as a loading control for total Ssp2. (E) Localization of Scr1-mEGFP with control EMM4S treatment or EMM4S plus 1 M KCl treatment using a microfluidics device. Images are single focal planes. Preswitch indicates image taken before switch to control or 1 M KCl medium. Scale bar, 8 μm. (F) Quantification of Scr1-mEGFP nuclear localization from microfluidics-based movies as in E. More than 50 cells/condition. Mean ± SD based on three individual biological replicates.

