FIGURE 6:
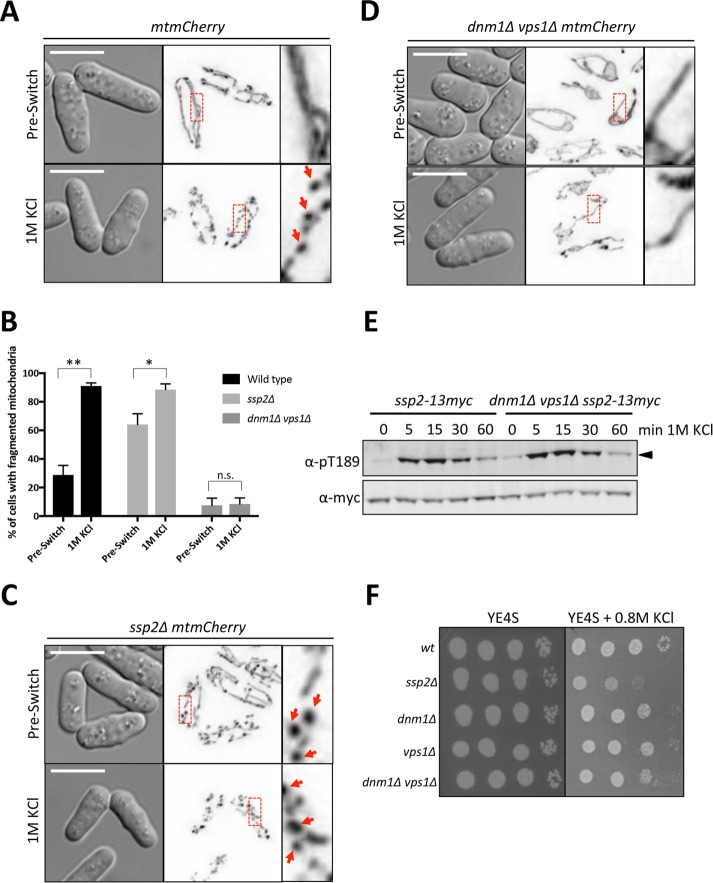
Fission of mitochondria during osmotic stress. (A) Representative images of mitochondria in wild-type cells before and after osmotic stress. (B) Quantification of cells expressing fragmented (beads-on-a-string) mitochondrial morphology, shown as a percentage of the total population. Three individual biological replicates were performed and >100 cells counted for each replicate. Mean ± SD. An unpaired t test was performed for statistical analysis with p values shown (*p < 0.05, **p < 0.01) as determined based on a two-tailed distribution. (C) Representative images of mitochondria in ssp2∆ cells before and after osmotic stress. (D) Representative images of mitochondria in dnm1∆ vps1∆ cells before and after osmotic stress. For A, C, and D, images on the left are DIC, and images in middle are corresponding inverted maximum projections for 0.2-μm-spaced z-sections through the entire cell (25 steps for 5 μm total). The red boxes are zoomed in on the right. Arrows denote “beaded” morphology. Scale bars, 5 μm. (E) Western blot showing activation kinetics of Ssp2-pT189 in dnm1∆ vps1∆ cells vs. wild-type cells in response to 1 M KCl osmotic stress. We used α-myc as a loading control for total Ssp2. (F) Tenfold serial dilutions of the indicated strains were spotted onto control (YE4S) plates or YE4S plates containing 0.8 M KCl. Cells were grown at 32°C.

