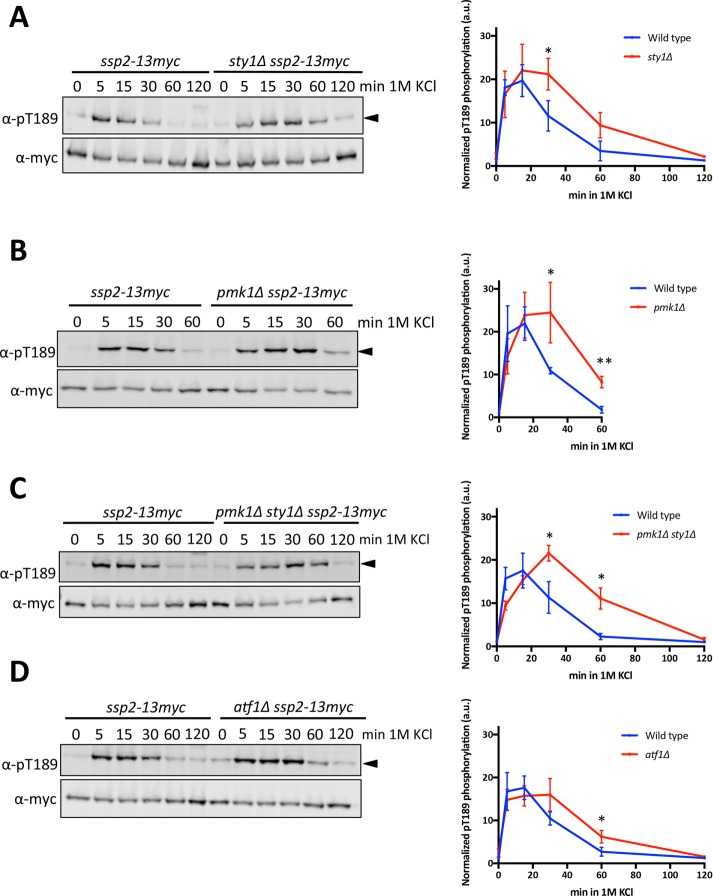
FIGURE 7:
SAPK cascades contribute to deactivation of Ssp2. (A) Activation kinetics of Ssp2-pT189 in wild-type and sty1∆ cells in response to 1 M KCl osmotic stress. Left, Western blot. Right, quantification of three biological replicates. (B) Activation kinetics of Ssp2-pT189 in wild-type and pmk1∆ cells in response to 1 M KCl osmotic stress. Left, Western blot. Right, quantification of three biological replicates. (C) Activation kinetics of Ssp2-pT189 in wild-type and pmk1∆ sty1∆ cells in response to 1 M KCl osmotic stress. Left, Western blot. Right, quantification of three biological replicates. (D) Activation kinetics of Ssp2-pT189 in wild-type and atf1∆ cells in response to 1 M KCl osmotic stress. Left, Western blot. Right, quantification of three biological replicates. For all results, α-myc was used as a loading control for total Ssp2. Values displayed are the mean ± SD based on three biological replicates. An unpaired t test was performed for statistical analyses, and p values were based on two-tailed distributions (*p < 0.05, **p < 0.01).

