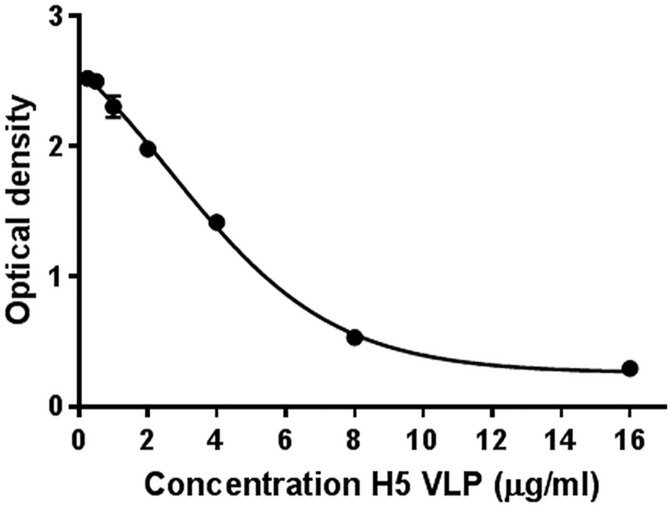
Fig 3. A standard curve was generated with H5 VLP from 0.25 to 16 μg/ml in a competitive ELISA.
The antibody at a concentration of 800ng/ml was mixed with different concentrations of H5 VLP and added to a pre-coated plate. The standard curve was obtained by plotting the mean absorbance (y axis) against the VLP concentration (x axis). A four parameter logistic regression was performed to fit the curve.

