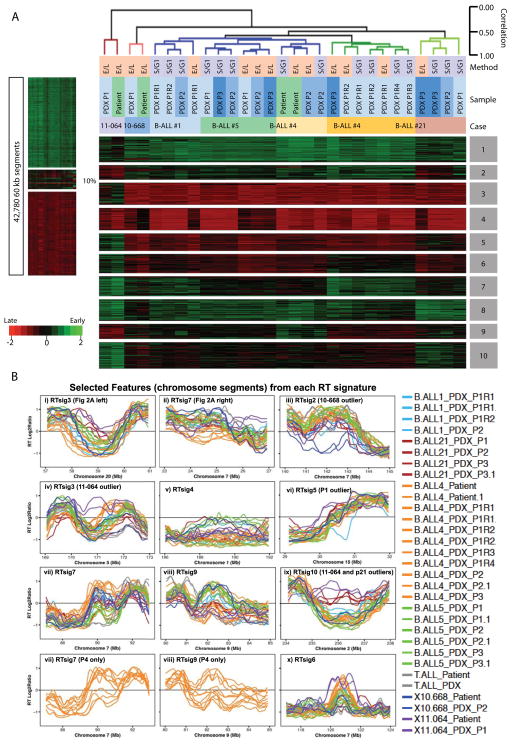
Figure 4. RT signatures distinguishing B-ALL patients are also preserved in PDX.
A. Similar analysis as shown in Figure 3 except that 60kb RT variable regions were defined as the top 10% regions of standard deviation amongst only the B-ALL patients and their PDX and only those patients and PDX were subjected to K-means and hierarchical clustering analysis. Clusters 3,5, and 6 are specific for patient 11-064. Clusters 7 and 9 distinguish the clonal architecture of patient 4 (see Figure 5). Cluster 10 is shared between 11-064 and Case21. B. Exemplary plots of selected RT signature features (chromosomal segments or rows in Fig 4A) with the K-means cluster indicated in each panel. As expected, this unbiased analysis identified the regions shown in Figure 2A that were detected by visual inspection (panels i and ii). Panels vii and viii show signature features that distinguish the different clones in Patient 4 (P4) and those P4 profiles are extracted and shown separately below each panel. Note that examples of features that are significantly different for one particular patient are shown (panels iii, iv, vi, ix) with the outlier patient indicated but most RT features are variable between all patients. All features distinguish some patients from others while each patient has a unique pattern within each RT signature.

