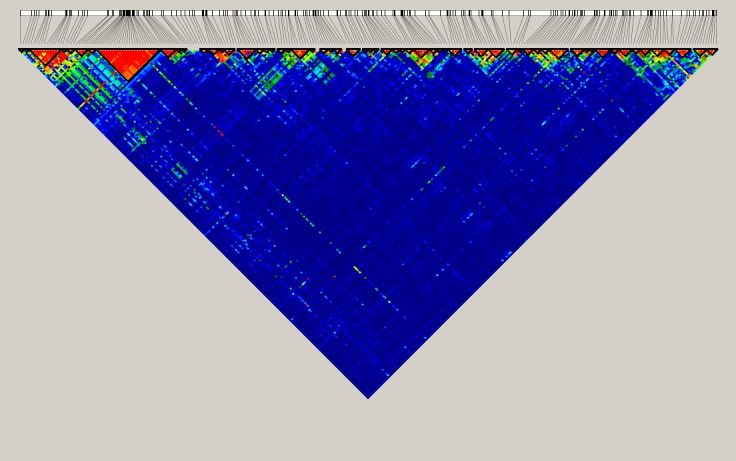
Fig 2. Linkage disequilibrium analysis of 262 SNPs from chromosomal region 16:53 500 000–55 500 000.

Pairwise linkage exhibited as LD coefficients (|D’|) between each pair of SNPs. Minor allele frequencies of all SNPs used in this analysis are ≥10%. Bolded triangles show haplotype blocks. Data were generated with Haploview version 4.2.
