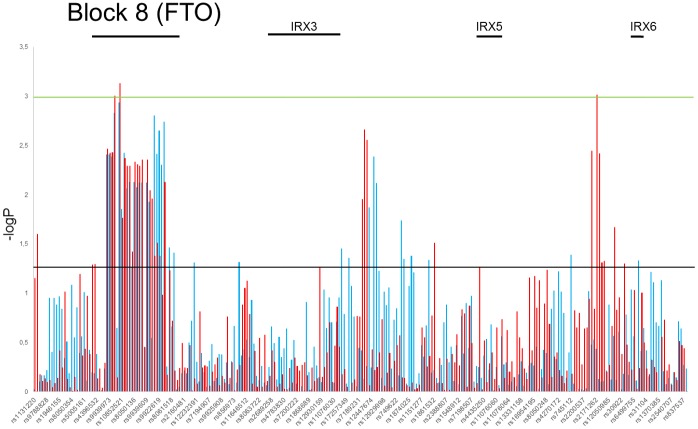
Fig 3. Distribution of estimated p values of the Chi square test in obesity phenotype stratified by age and sex.
P values were calculated in the test of independence between the obesity phenotype and MAFs at tested SNPs (S4 Table). The y axis shows the −log10 p values of 262 SNPs obtained in obesity versus normal weight association analysis, and the x axis shows their rs numbers. Horizontal black and green lines represent the thresholds of p = 0.05 for significance without multiple correction and p = 8.2E-04 for LD block significance, respectively. Red and blue columns represents females and males group, respectively.

