. 2017 Jun 23;6:e26664. doi: 10.7554/eLife.26664

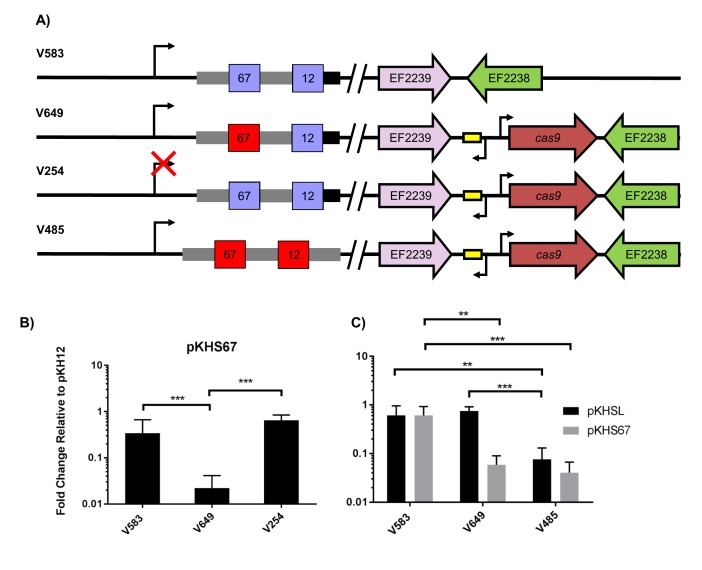
Figure 2. Assessment of CRISPR2 function in V583.

(A) Genotypes of relevant strains are diagrammed. In V485, the CRISPR2 terminal repeat is replaced with a direct repeat. Spacers in red were experimentally determined to provide genome defense, while blue spacers do not provide genome defense. (B) Conjugation frequencies relative to pKH12 are plotted for pKHS67 transfer into V583, V649, and V254. The geometric mean and geometric standard deviation are shown for 4 independent biological replicates. (C) Conjugation frequencies relative to pKH12 are plotted for pKHSL and pKHS67 transfer into V583, V649, and V485. pKHSL contains the S12 sequence from the V583 CRISPR2 array. The geometric mean and geometric standard deviation for 3 independent biological replicates are shown. ***p<0.001, **p<0.01.

DOI: http://dx.doi.org/10.7554/eLife.26664.005

Figure 2.

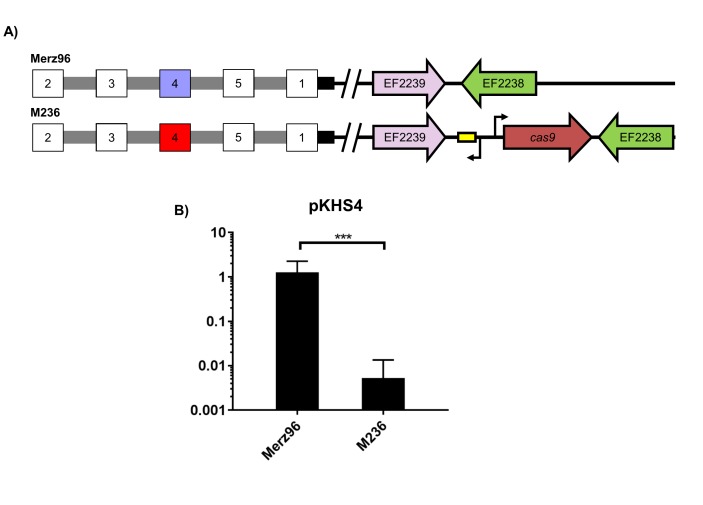
Figure 2—figure supplement 1. CRISPR2 function in Merz96.

Figure 2—figure supplement 1.

(A) Relevant genotypes are shown. Red spacers provide interference, blue spacers do not provide interference, and white spacers were not examined in the assay. (B) Conjugation frequencies of pKHS4 relative to pKH12 are shown for Merz96 and M236 for 4 independent biological replicates. ***p<0.001.
Figure 2—figure supplement 2. Repeat alignments.

Figure 2—figure supplement 2.

Alignments of the consensus direct repeat, the CRISPR2 terminal repeat, and the CRISPR1 terminal repeat are shown. Bases underlined indicate those that differ from the consensus CRISPR2 direct repeat.
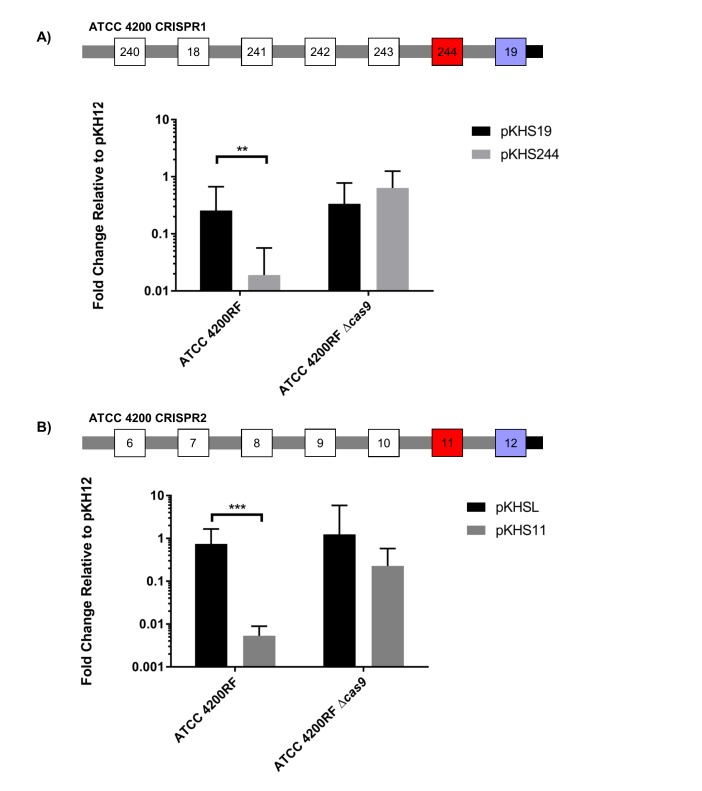
Figure 2—figure supplement 3. Conjugation of plasmids containing terminal spacers are unaffected by deletion of cas9.

Figure 2—figure supplement 3.

Conjugation experiments are shown for terminal spacers and non terminal counterparts for (A) CRISPR1 and (B) CRISPR2 in ATCC 4200RF. Respective CRISPR2 arrays are shown. Spacers that showed no evidence of CRISPR defense are shown in blue. Geometric mean and geometric standard deviation are shown for 4 and 3 independent biological replicates for CRISPR1 and CRISPR2, respectively. **p<0.01, ***p<0.001.
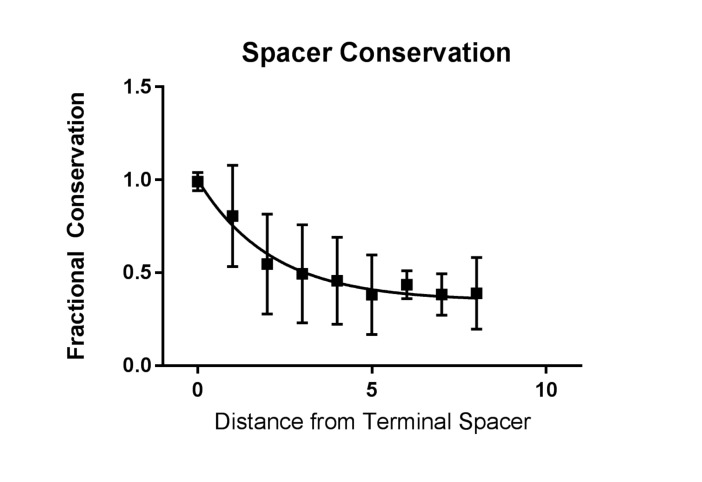
Figure 2—figure supplement 4. Conservation of spacers across CRISPR2.

Figure 2—figure supplement 4.

The fraction of conservation is defined by the weighted average of the frequency of occurrence of any spacer at any given position. A value close to one indicates that a spacer found at that particular position is likely to only be found in that position. The conservation value is plotted against the distance, in spacers, from the terminal spacer.