. 2017 Jun 23;6:e26664. doi: 10.7554/eLife.26664

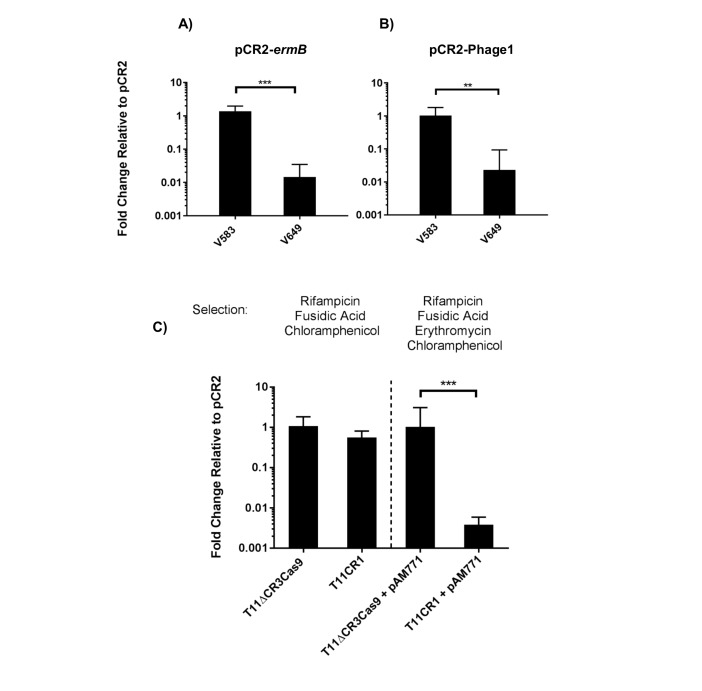
Figure 7. Transfer frequencies of 'self-targeting' plasmid constructs.

(A) Conjugation frequency with pCR2-ermB are shown relative to pCR2 in V583 and V649. Transconjugants were selected on vancomycin and chloramphenicol. (B) Conjugation frequency with pCR2-Phage1 are shown relative to pCR2 in V583 and V649. (C) Conjugation frequency of pCR2-ermB are shown relative to pCR2 with varying transconjugant selection in T11RFΔCR3cas9 and T11CR1. The geometric mean and geometric standard deviation of 3 independent biological replicates are shown. **p<0.01, ***p<0.001.

DOI: http://dx.doi.org/10.7554/eLife.26664.017

Figure 7.

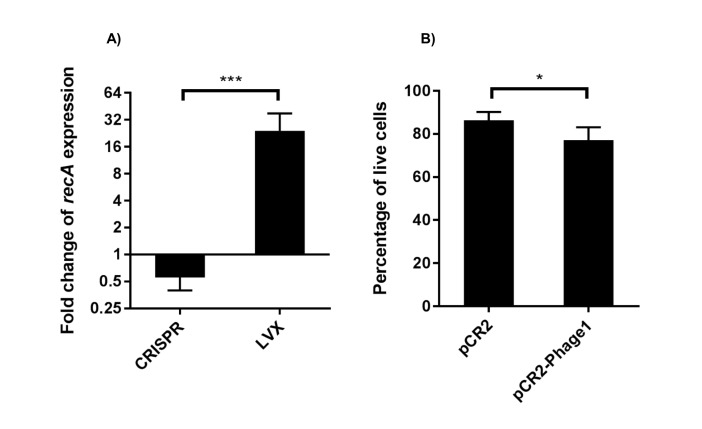
Figure 7—figure supplement 1. RT-qPCR analysis of recA transcript levels and live cell quantification.

Figure 7—figure supplement 1.

(A) Fold change of recA transcript levels are shown (geometric mean and geometric standard deviation) for CRISPR chromosomal targeting (comparing pCR2-Phage1 with pCR2) and LVX treatment. Normalization of Cq values and sample preparation are described in the materials and methods. Differences in fold changes of recA transcript levels between CRISPR and LVX treatment are statistically significant using a two-tailed student’s T test (p<0.001) assuming log normal distribution. (B) Percentages of live cells (arithmetic mean and standard deviation) between the presence and absence of chromosomal CRISPR targeting using pCR2-Phage1 and pCR2 are shown. Results are statistically significant using a one-tailed student’s T test (p=0.044). Three independent biological experiments were performed in (A) and (B).