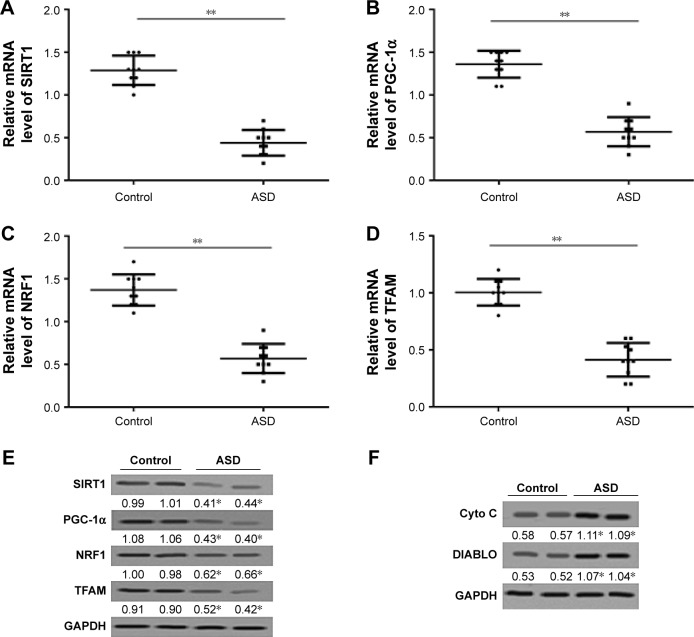
Figure 3.
Relative mRNA and protein expression levels of SIRT1, PGC-1α, NRF1, and TFAM and cyto c and DIABLO released from mitochondria to the cytosol in the ASD and control LCLs.
Notes: (A) Relative mRNA expression levels of SIRT1 (n=10). (B) Relative mRNA expression levels of PGC-1α (n=10). (C) Relative mRNA expression levels of NRF1 (n=10). (D) Relative mRNA expression levels of TFAM (n=10). (E) SIRT1, PGC-1α, NRF1, and TFAM protein expression levels detected by Western blot assays. (F) cyto c and DIABLO protein expression levels detected by Western blot assays. Representative gels were from two different samples out of 10 samples. *P<0.05, **P<0.01 compared with control group.
Abbreviations: ASD, autistic spectrum disorder; LCL, lymphoblastoid cell line.

