Figure 4.
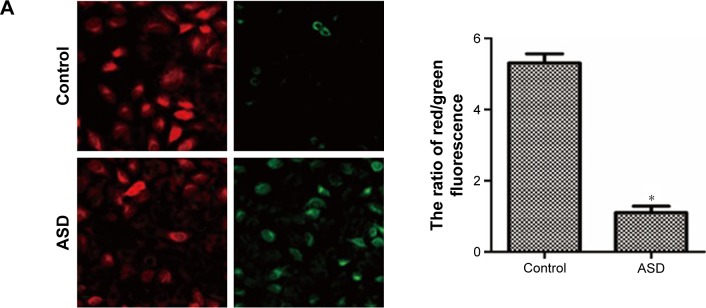
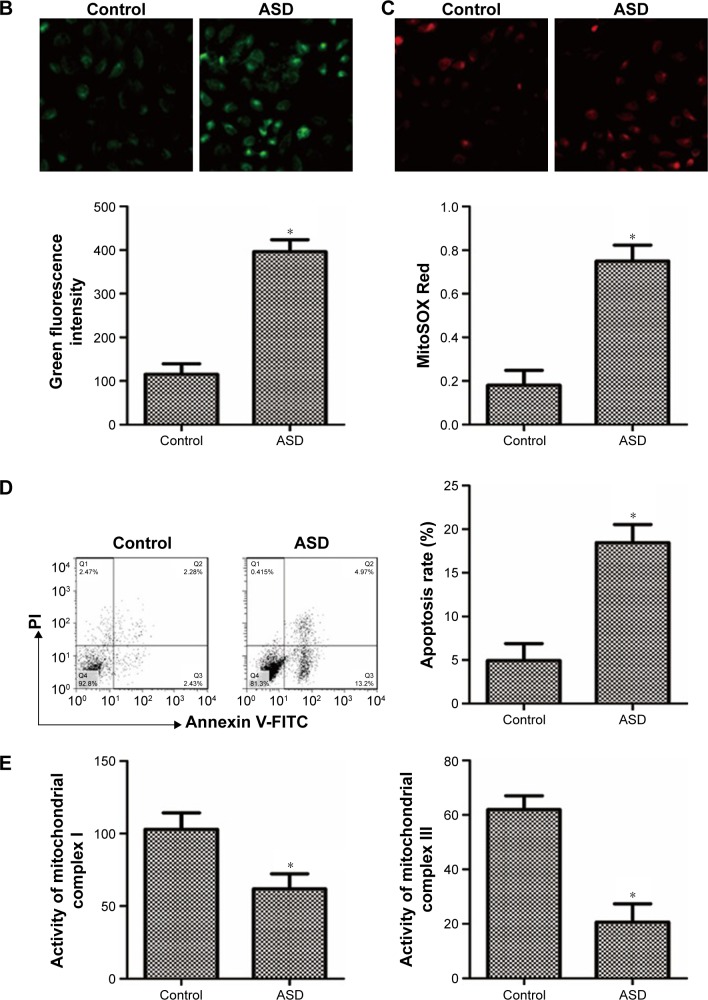
ASD induced upregulation of intracellular ROS and mitochondrial ROS generation and apoptosis of LCLs.
Notes: (A) The representative images showed changes in mitochondrial transmembrane potential (ΔΨm) in the control and ASD LCLs. Magnification, 100×. The graph represents the ratio of red/green fluorescence (n=3). (B) The representative images showed intracellular ROS detected by DCFH-DA staining. Magnification, 100×. The graph represents the intensity of green fluorescence (n=3). (C) The representative images showed mitochondria ROS production detected by MitoSOX staining. Magnification, 100×. The MitoSOX fluorescence intensity in the control and ASD LCLs (n=3). (D) Cells were double stained with Annexin V-FITC and PI and analyzed by flow cytometry. And percentage of apoptotic cells is shown in the histogram (n=3). (E) Enzymatic activity of mitochondrial complex I and complex III in the control and ASD LCLs (n=3). *P<0.05 compared with the control LCLs.
Abbreviations: ASD, autistic spectrum disorder; LCL, lymphoblastoid cell line; ROS, reactive oxygen species.


