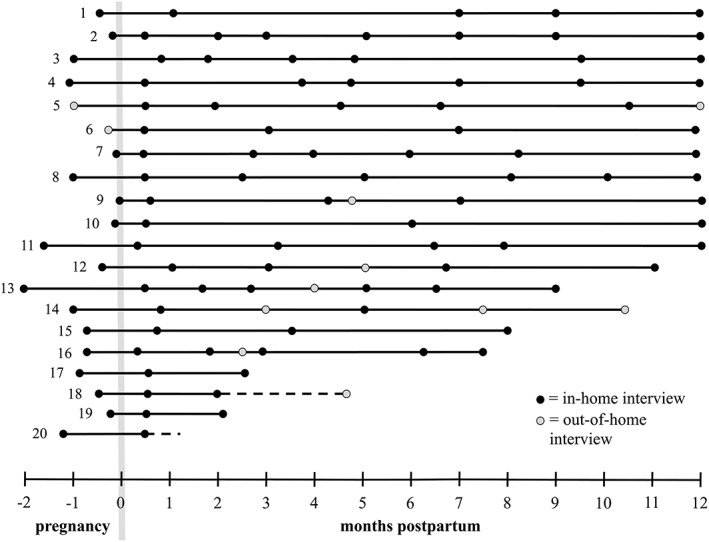
Figure 2.

Frequency and distribution of semistructured interviews with study participants from pregnancy through up to 1 year postpartum. This figure shows the duration of participation (in months) and the distribution and frequency of interviews for each participant. Each line represents a participant, listed top to bottom roughly by duration of human milk–feeding. Each circle represents a participant interview. Dotted lines indicate that participants left the study and initiated contact afterward—one to report a new pregnancy and discuss her future intentions for pumping and one to report a sudden move that necessitated study exit
