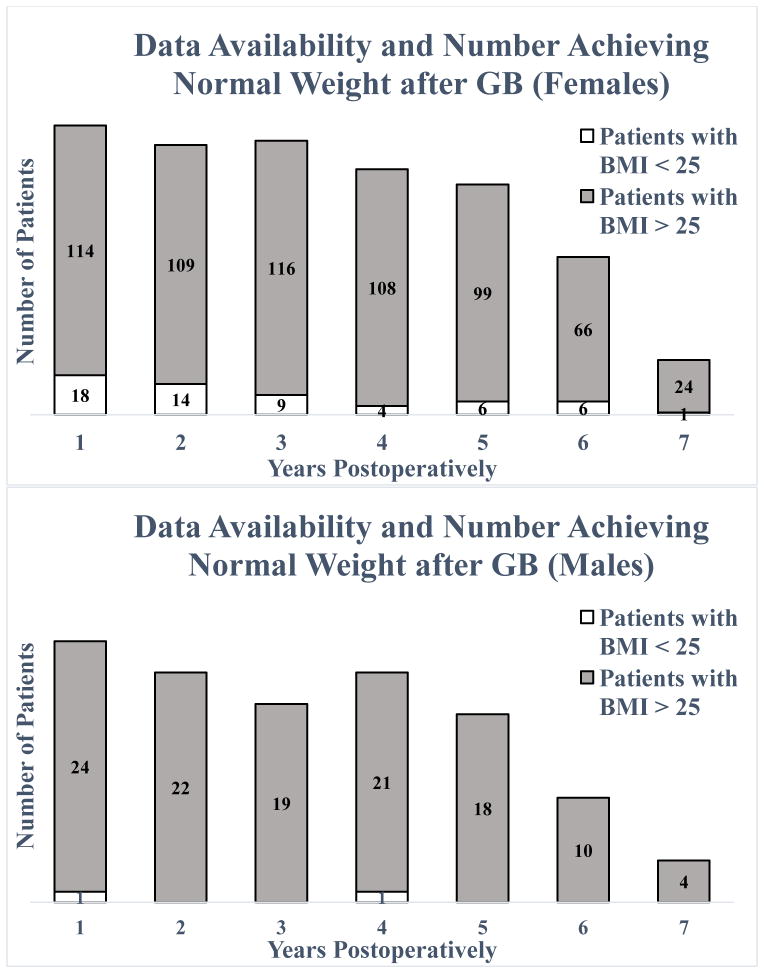
Figure 1.
Data availability for females (top) and males (bottom) denoting patients who achieved BMI < 25 kg/m2 at a given time point (dotted) and those who did not (solid). The total number of patients at each time is the sum of these two data points. For females, this is 132, 123, 125, 112, 105, 72, and 25 patients at 1–7 years, and for males, this is 25, 22, 19, 22, 18, 10, and 4 patients at 1–7 years. A patient who had normal BMI at multiple visits will be counted at each of those time points. GB, gastric bypass.

