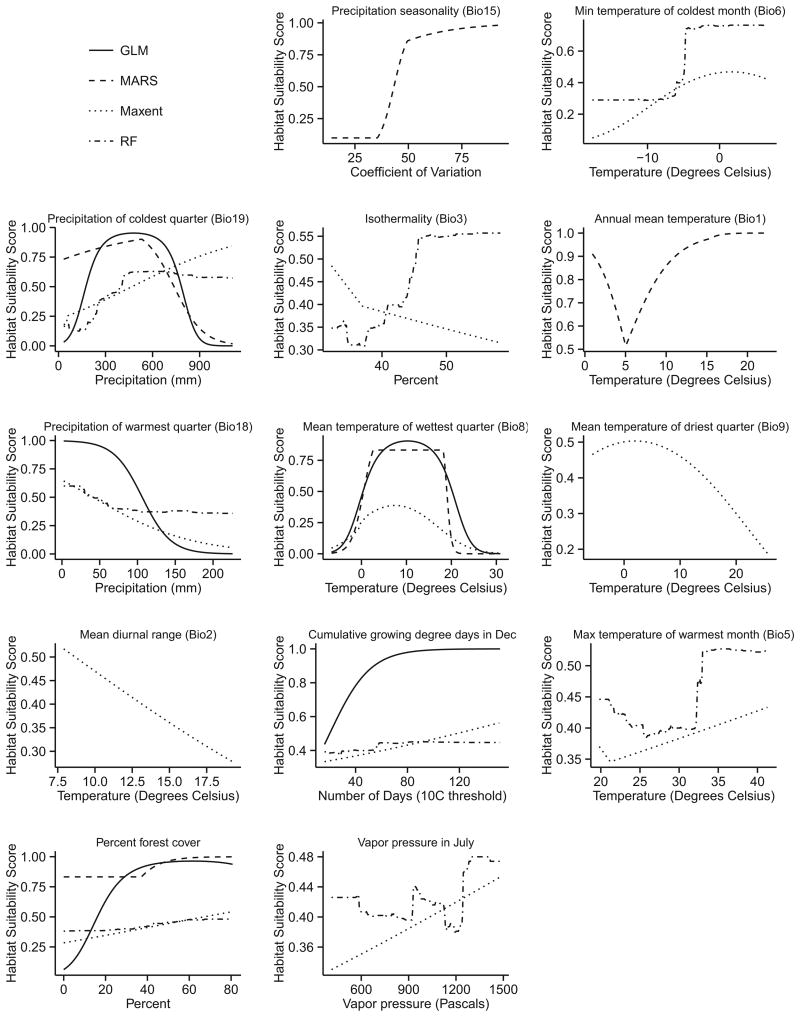
Fig. 4.
Response curves for the climate, elevation, or land cover predictor variables selected by the optimized Ixodes pacificus models. The x-axis represents the range of each predictor in the training dataset, and the y-axis represents the associated probability of suitable habitat (0= not suitable, 1=maximum suitability).

