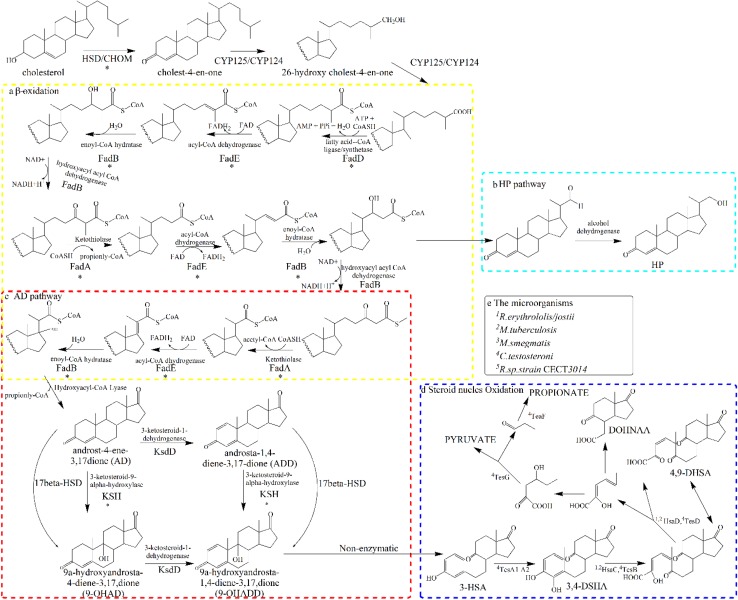
Fig. 7.
The deduced cholesterol catabolic pathway of MN2. The side-chain degradation of cholesterol is shown in the dashed yellow box (a). The HP pathway is shown in the dashed light green box (b). The conversion of AD to ADD and AD to 9-OHAD are shown in the dashed red box (c). The Steroid Oxidation is shown in the blue box (d). Each step involved in the reaction of the enzyme (d) in front of the number representatives the different microorganisms show in the e (means that different steps of the biocatalytic reaction has different genes in different microorganisms). Reactions marked with asterisk refer to genes that were mutated following UV and chemical mutagenesis

