
Figure 5.
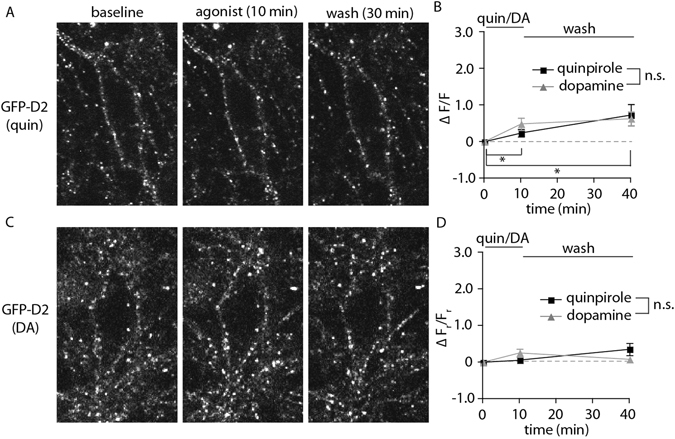
GFP-D2 receptors show limited internalization. (A, C) Representative 2-photon images of live neurons at baseline, following 10 minutes of agonist bath application (quinpirole 10 µM-A, dopamine 100 µM-C), and following 30 minutes of agonist-free wash. Slices were incubated in anti-GFP-AF594 to label GFP-D2 receptors prior to imaging. (B) The change in fluorescence inside the neuron (ΔF/F) increases modestly but significantly over baseline following the agonist application and wash. There was no difference between the agonists used (n = 6 for both, two-way ANOVA followed by Bonferroni). (D) The change in the ratio of intracellular fluorescence to membrane fluorescence (ΔFr/Fr) did not change significantly from baseline following agonist application or wash (n = 6 for both, two-way ANOVA followed by Bonferroni). *p < 0.05.