Figure 6.

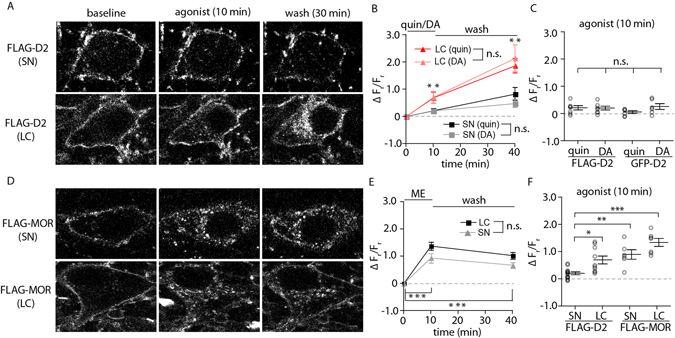
FLAG-tagged receptors reveal specificity of limited D2 receptor internalization. (A) Representative images of live neurons at baseline, following 10 minutes of agonist bath application (quinpirole 10 µM, dopamine 100 µM), and following 30 minutes of agonist-free wash. Slices were incubated in anti-FLAG M1-AF594 to label FLAG-tagged D2 receptors in the SN and LC prior to imaging. (B) FLAG D2 receptors in SN dopamine neurons show limited internalization following agonist exposure as measured by the change in the ratio of intracellular to membrane fluorescence (ΔFr/Fr), only significant following the 30-min wash (not specified on graph). FLAG-D2 receptors in the LC show a significantly larger increase in the intracellular fluorescence relative to the membrane fluorescence (ΔFr/Fr) when compared with FLAG-D2 receptors in SN neurons (n = 5–7, two-way ANOVA followed by Bonferroni). (C) The ΔFr/Fr following 10 minutes of agonist exposure was not significantly different between GFP-D2 and FLAG-D2 receptors for either quinpirole or dopamine (n = 5–7, two-way ANOVA followed by Bonferroni). (D) Representative images of live neurons at baseline, following 10 minutes of agonist bath application ([Met]5enkephalin ME, 30 µM), and following 30 minutes of agonist-free wash. Slices were incubated in anti-FLAG M1-AF594 to label FLAG-tagged µ-opioid receptors (MORs) in the SN and LC prior to imaging. (F) In both the SN and LC, FLAG-MORs show a sharp increase in ΔFr/Fr following agonist exposure. There was a slight decrease in ΔFr/Fr following the 30-minute wash period. (F) FLAG-D2 receptors in the LC and FLAG-MORs in both the SN and LC show significantly larger ΔFr/Fr following agonist application than FLAG-D2 receptors in the SN (n = 6–14, two-way ANOVA followed by Bonferroni). n.s. denotes not significant, *p < 0.05, **p < 0.01, ***p < 0.01.
