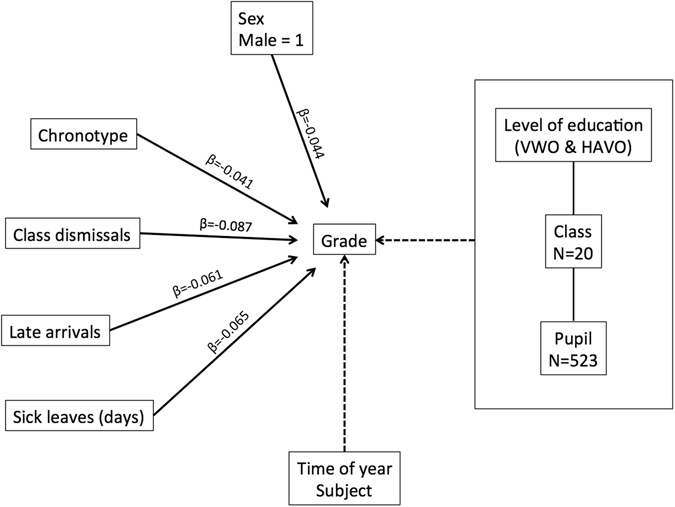
Figure 1.

Multilevel model selected as the most parsimonious fit (according to the AIC) to explain the influence of the independent variables on school grades (dependent variable). The explanatory (independent) variables were: sex, chronotype (MSFsc), late arrivals during the first hour, class dismissals, and sick leaves (duration). The standardised beta coefficients (β) were negative for each variable and are reported on the solid connecting lines between independent and dependent variables. The interpretation of a negative beta coefficient is the following: for every 1-standard deviation increase in the explanatory variable, the standard deviation of the dependent variable will decrease by the beta coefficient value. For the variable ‘sex’, males were compared with females, meaning that a negative beta coefficient reflected a decrease in grades for males. Time of year and school subject were evaluated in the model as covariates (dashed connecting lines).
