Figure 2.

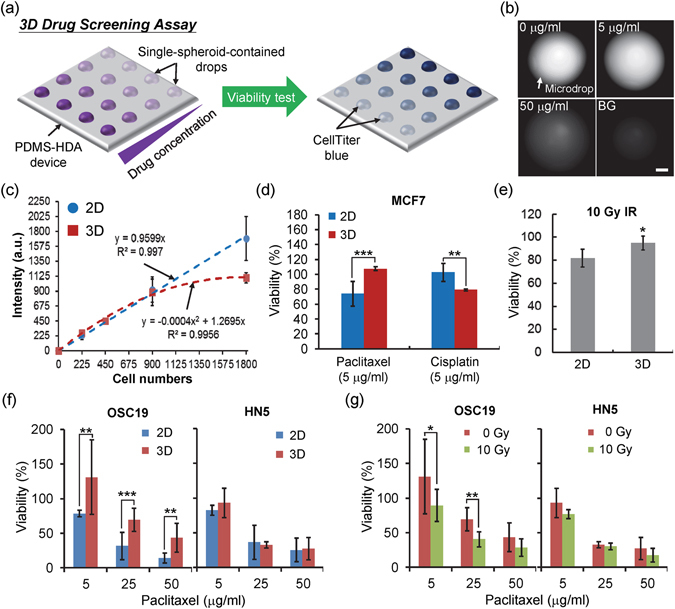
Three-dimensional cell culture by PDMS-HDA reveals diverse drug sensitivity characteristics compared with 2D culture. (a) Procedure of drug screening by PDMS-HDA. (b) Fluorescent images showing the single MCF7 spheroid-containing drops dispensed with Celltiter-Blue after incubation for 4.5 h. The cellular spheroids were treated with paclitaxel at different concentrations for 2 days before examining cellular viability. BG represents the drop that contained no cells. Scale bar, 500 μm. (c) Relationship between the initial cell number per drop and the resulting fluorescent intensity of the CellTiter-Blue. Each data represents the mean ± SEM (n = 3~4). a.u., arbitrary unit. (d) Drug responses of 2D- and 3D-cultured MCF7 cells treated with paclitaxel or cisplatin (5 μg/ml) for 48 h. The data are presented as mean ± SEM from 2 independent experiments (n = 8~10) of paclitaxel treatment and from 3 experiments (n = 11~12) of cisplatin treatment. (e) Irradiation sensitivities of MCF7 cells cultured in either 2D or 3D over 2 days after γ-ray treatment. The data are presented as mean ± SEM from 2 independent experiments (n = 8~9). (f) and (g) Dose responses of OSC19 and HN5 cells treated with paclitaxel at different concentrations (cells either cultured in 2D or 3D) and with the combined treatment of paclitaxel and irradiation (cells cultured in 3D) for 2 days. Each bar represents the mean ± SEM from 3 independent experiments (n = 9~15). *p < 0.05, **p < 0.01, and ***p < 0.001 indicate statistical significance.
