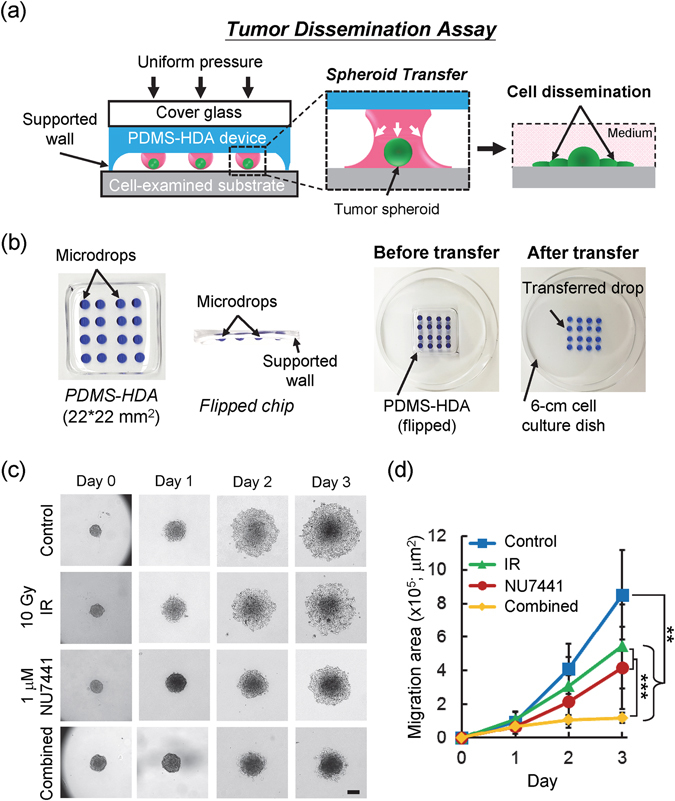
Figure 3.

Tumor spheroid dissemination assay. (a) Design concept of the tumor dissemination assay by PDMS-HDA. (b) Example of in-situ transfer of the cell spheroid-containing drop array (4*4 array highlighted by blue dyes; 11 μl per drop) from the device to the appropriate cell-examined substrate (e.g. cell culture dish). (c) Time-sequenced images showing the dissemination of HCT116 spheroids over a 3-day culture, in which cells were treated with irradiation, NU7441, or combined treatment from day 0. Scale bar, 200 μm. (d) Spheroid migration area correspondingly measured from day 0 to 3. Each data represents the mean ± SEM from 2 independent experiments (n = 17~29; **p < 0.01, ***p < 0.001).
