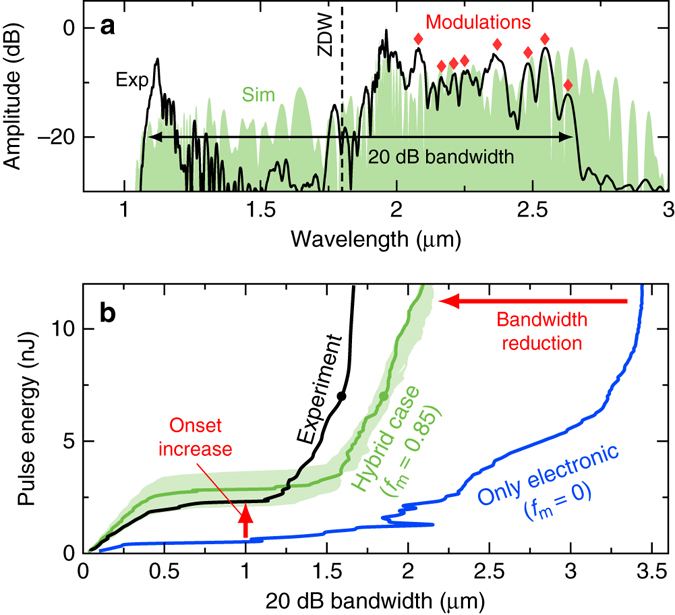
Fig. 6.

Indications for hybrid soliton dynamics. a Measured (exp) and simulated single-shot (sim) spectra at the output of a CS2/silica LiCOF (fibre length: 7 cm, core diameter: 4.7 μm). The red diamonds mark a few locations of spectral fringes. ZDW zero-dispersion wavelength. b Measured and simulated bandwidth at 20 dB spectral contrast for increasing input energy in comparison to an equivalent fibre with entirely instantaneous response (f m = 0). The circles label the positions of the spectra at 7 nJ shown in a. The light green area denotes simulations incorporating deviations of the non-instantaneous nonlinear response model and the pulse duration leading to f m = 0.85 ± 0.04 and γ = 0.28 ± 0.06 m−1W−1
