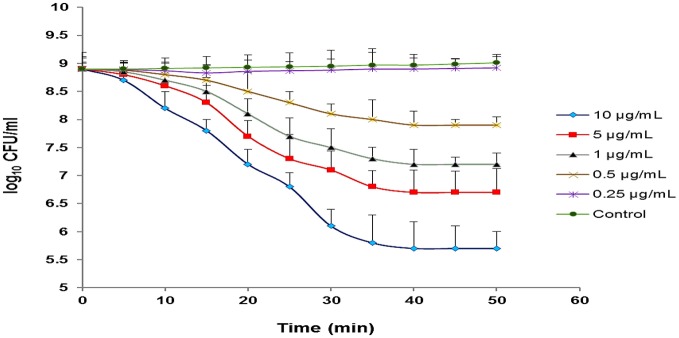
Figure 8.
Monitoring the lytic activity of various concentrations of CHAP-amidase against MRSA252 cells in MHB medium. The graphs show changes in the colony count of MRSA252 cells during a 60-min incubation time. The lysin buffer, rather than the enzyme, was added to negative control. Values are the means of three independent experiments with standard deviation indicated by error bars. Statistical significance was reported as P < 0.05.

