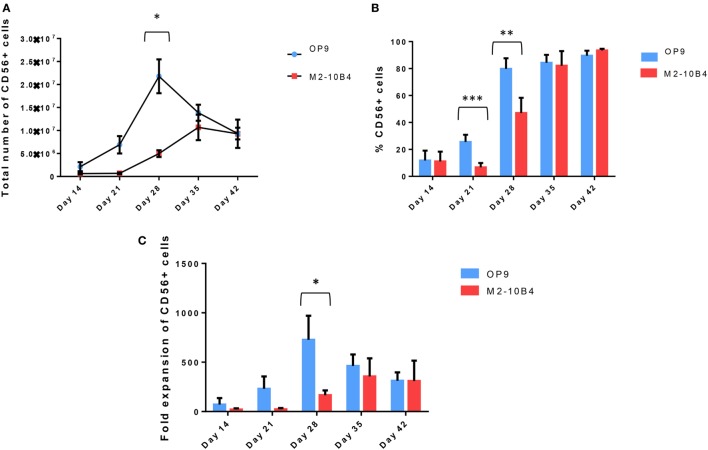
Figure 1.
(A) Total number of CD56+ cells at different time points during the in vitro differentiation protocol with the two different culture conditions: OP9 and M2-10B4 cells coculture. (B) Percentage of CD56+ cells at different time points of the differentiation protocol with the two different culture conditions: OP9 and M2-10B4 cells coculture. (C) Fold expansion of the CD56+ cells regarding the initial number of CD34+ cells plated in each experiment (n = 4). The bars represent the mean and error bars represent SEM. p-Value: *p < 0.05, **p < 0.005, and ***p < 0.001. The absence of any asterisk indication means there are no significant differences.

