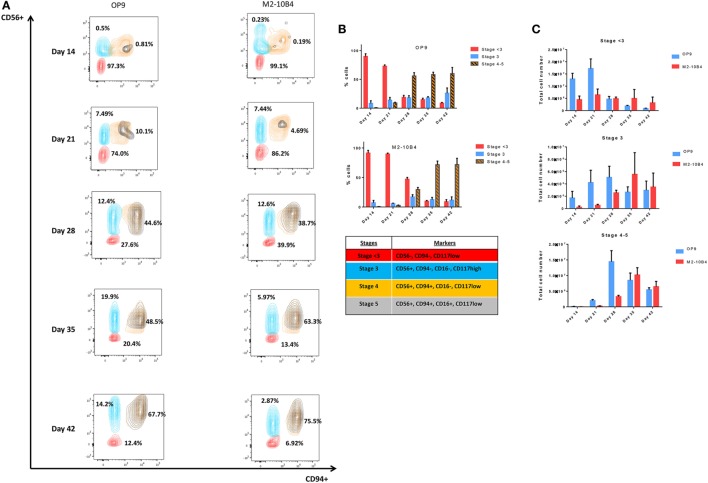
Figure 2.
(A) Contour plots representing the different natural killer (NK) cell maturation stages during the differentiation protocol using OP9 and M2-10B4 cells as feeder layers. CD94, CD56, and CD16 markers were analyzed to determine the maturation stage as described in the text. Numbers represent the percentage of cells in stage <3 (red), stage 3 (turquoise), and stages 4–5 (orange and black). (B) Percentage of NK cells in the different stages of maturation (<3, 3, and 4–5) along the differentiation time course. (C) Total number of cells in the different stages (<3, 3, and 4–5) cultured with the two conditions: OP9 and M2-10B4 cells coculture. The bars represent the mean and error bars represent SEM (Stage <3: CD56−, CD94−, CD117low; Stage 3: CD56+, CD94−, CD16−, CD117high; Stage 4: CD56+, CD94+, CD16−, CD117low, and Stage 5: CD56+, CD94+, CD16+, CD117low).

