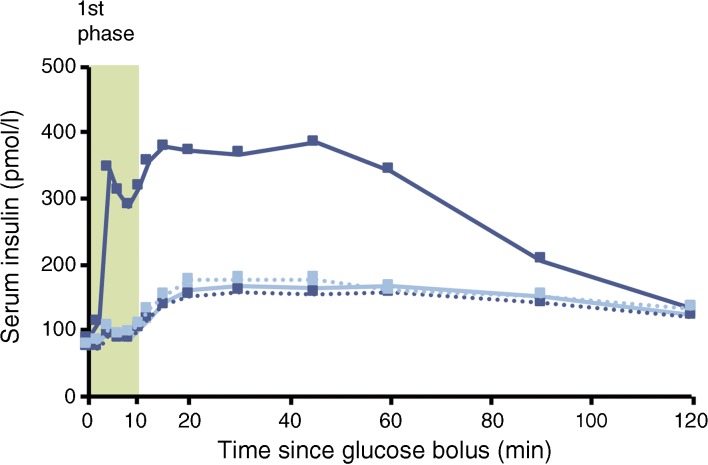
Fig. 2.
Geometric mean insulin response to an IVGTT in participants with type 2 diabetes before and after 12 weeks of treatment with semaglutide (n = 37, dark blue) or placebo (n = 37, light blue). One participant who received an incorrect glucose dose was excluded from all IVGTT analyses. Dotted lines represent baseline values and solid lines represent end of treatment values

