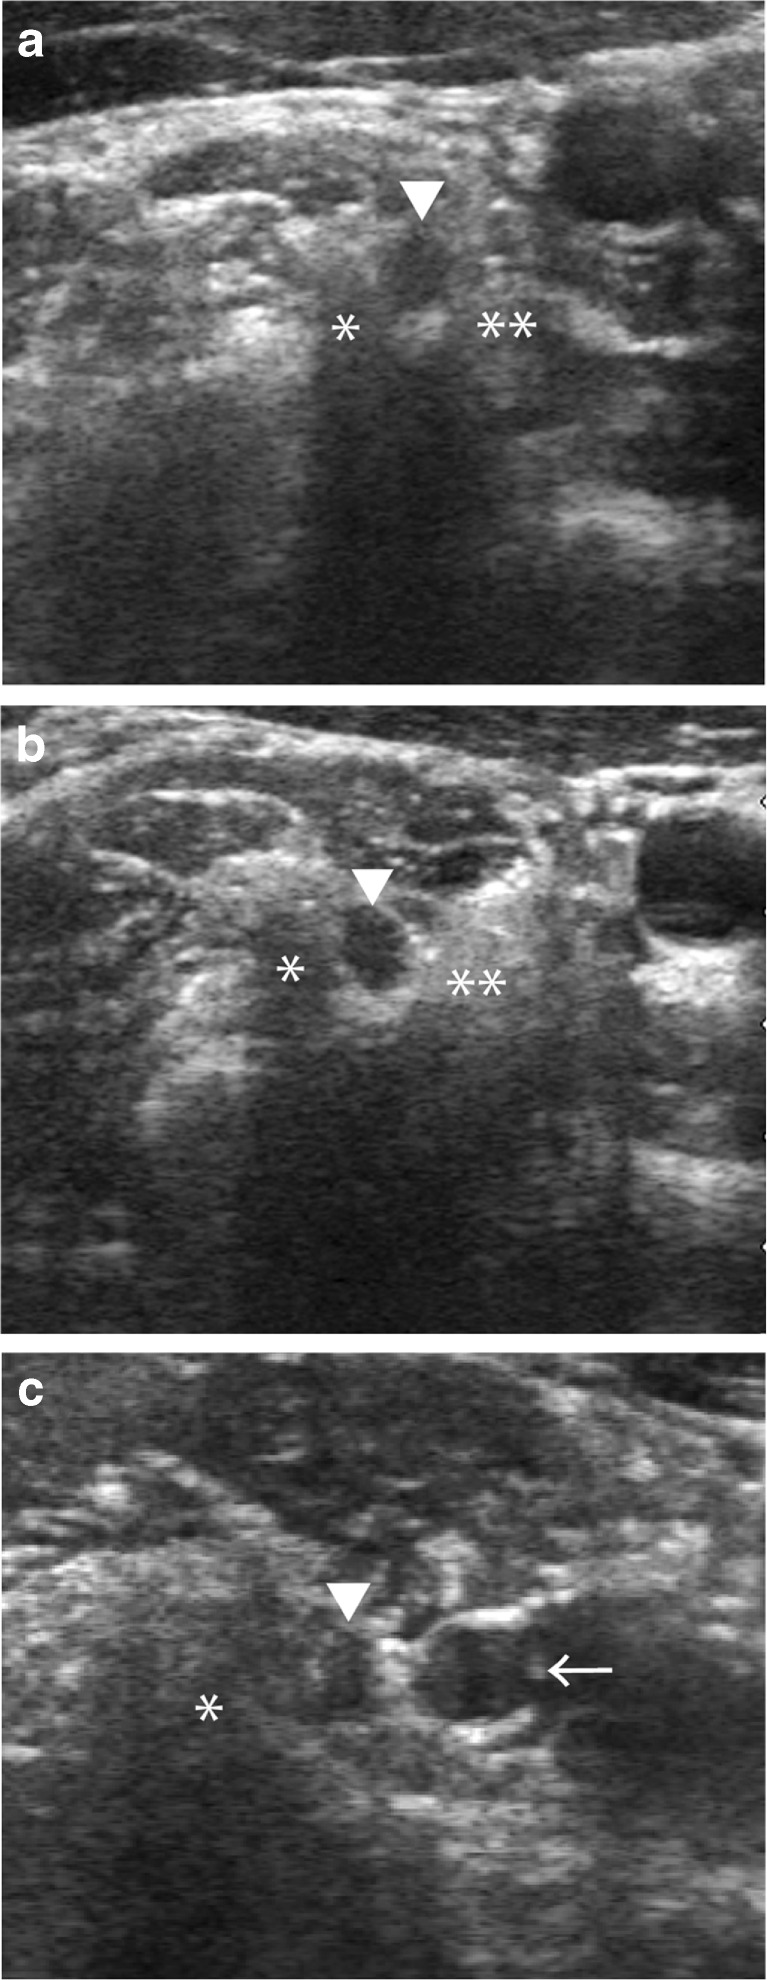
Fig. 1.
Axial ultrasonographic images (a: C5, b: C6, c: C7 level) of the cervical NRs of a normal subject. (a) Axial ultrasonographic image showing the C5 (▼) NR between the anterior (**) and posterior processes (*) at the C5 level. (b) Axial ultrasonographic image showing the C6 (▼) NR between the anterior (**) and posterior processes (*) at the C6 level. (c) Axial ultrasonographic image showing the C7 (▼) NR, vertebral artery (←) and posterior process (*) at the C7 level. NR nerve root

