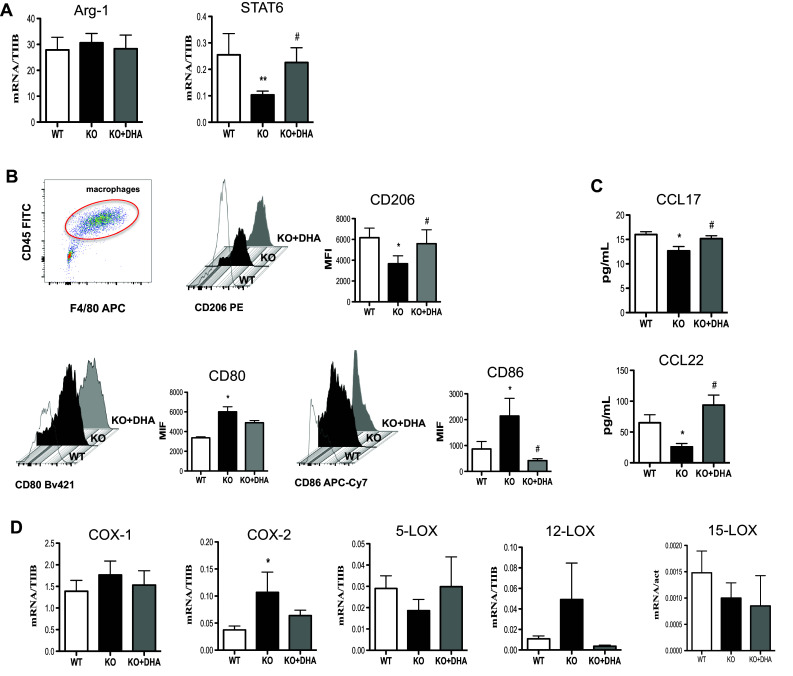
Fig. 3.

Analysis of M2 markers in macrophages obtained from Elovl2−/− and WT mice fed with diet enriched or not in DHA. Monocytes obtained from bone marrow of Elovl2−/− (KO) and WT mice fed with diet enriched or not in DHA and differentiated into M2 using M-CSF (50 ng/ml) and IL-4 (20 ng/ml). a mRNA analysis of Arg-1 and STAT6 by RT-PCR. Data are shown as mean (±sem) of ten independent experiments, each in duplicate. b CD206, CD80 and CD86 amount by flow cytometry upon staining cells at cell surface. Data are reported as mean fluorescence intensity (MFI), and are representative of eight independent experiments ± sem c ELISA of CCL-17 and CCL-22 levels in supernatants of M2 macrophages. Data are reported as pg/ml, and are representative of five independent experiments ± sem, each in duplicate. d mRNA analysis of cyclooxygenases (COX-1 and COX-2) and lipoxygenases (5-LOX, 12-LOX, 15-LOX). *Denotes p < 0.05 versus WT; **denotes p < 0.01 versus WT. #Denotes p < 0.05 versus KO
