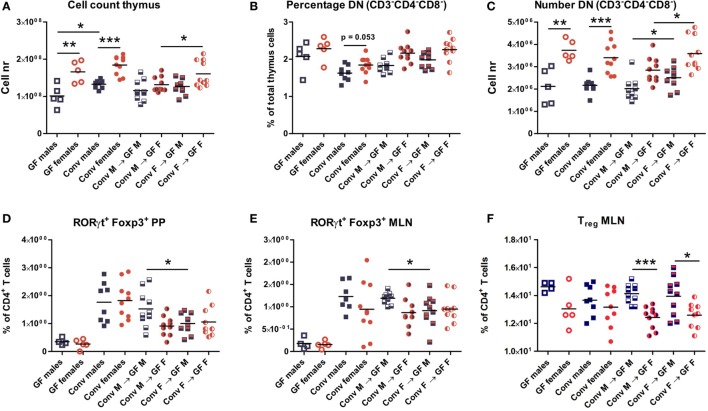
Figure 2.
Cells from thymus, spleen, Peyer’s patches (PPs), and mesenteric lymph nodes (MLNs) were analyzed with flow cytometry. Germ-free (GF) males (M) (n = 5), GF females (F) (n = 5), conventional (conv) males (n = 8), and females (n = 10) were included as controls. Experimental groups of GF recipients of gut microbiota each contained 10 mice per group. (A) Total number of thymus cells. (B) Percentage among live thymus cells of lineage negative (CD11b, CD11c, CD19, CD45R/B220, NK1.1, and TER119) cells that were also double negative (DN) for CD4 and CD8. (C) Absolute numbers of thymus cells that were lineage negative (CD11b, CD11c, CD19, CD45R/B220, NK1.1, and TER119) and also DN for CD4 and CD8. (D) Percentage of RORyt+Foxp3+ cells among CD4+ T cells in PPs. (E) Percentage of RORyt+Foxp3+ cells among CD4+ T cells in MLN. (F) Percentage of CD25+Foxp3+ regulatory cells (Treg) among CD4+ T cells in MLN. * indicates p < 0.05, ** indicates p < 0.01, and *** indicates p < 0.001.

