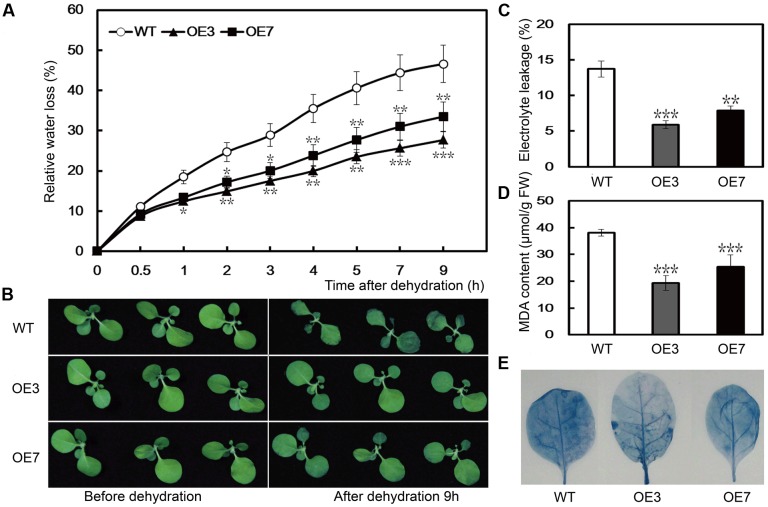
FIGURE 7.
Dehydration stress resistance analysis of transgenic lines. (A) Phenotypes of 30-days-old WT tobacco and the two transgenic lines (OE3 and OE7) before (left) and after (right) dehydration for 9 h at ambient environment. (B) Fresh water loss rate of WT, OE3, and OE7 during a 9 h dehydration stress. (C–E) EL (C), MDA (D), and cell death (E) in the transgenic lines and WT determined after dehydration stress. Asterisks indicate that the value is significantly different from that of the WT at the same time point (∗∗P < 0.01; ∗∗∗P < 0.001).

