Figure 1.
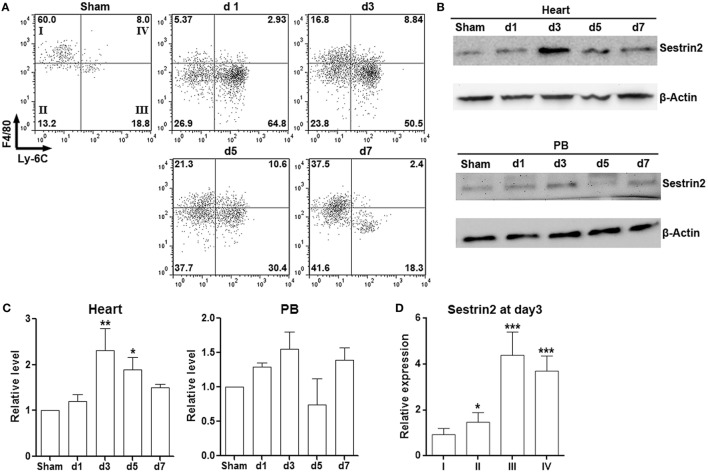
Sestrin2 is expressed in cardiac macrophages after myocardial infarction (MI). (A) Representative flow cytometry dot plots showing cardiac macrophage subpopulations in infarcted myocardium at day 1, day 3, day 5, and day 7 after MI. Numbers in the quadrants are proportions of corresponding subpopulations. Sham: Sham-operated animal. This is a representative of three independent experiments. (B) Sestrin2 protein levels in total cardiac macrophages (upper panel) and blood monocytes (lower panel). (C) Statistics for (B). N = 3 per group. *p < 0.05; **p < 0.01; ***p < 0.001 compared with d1 group. (D) mRNA abundance of Sestrin2 in four cardiac macrophage subpopulations at day 3 after MI. *p < 0.05; **p < 0.01; ***p < 0.001 compared with subpopulation “I.”

