Figure 7.
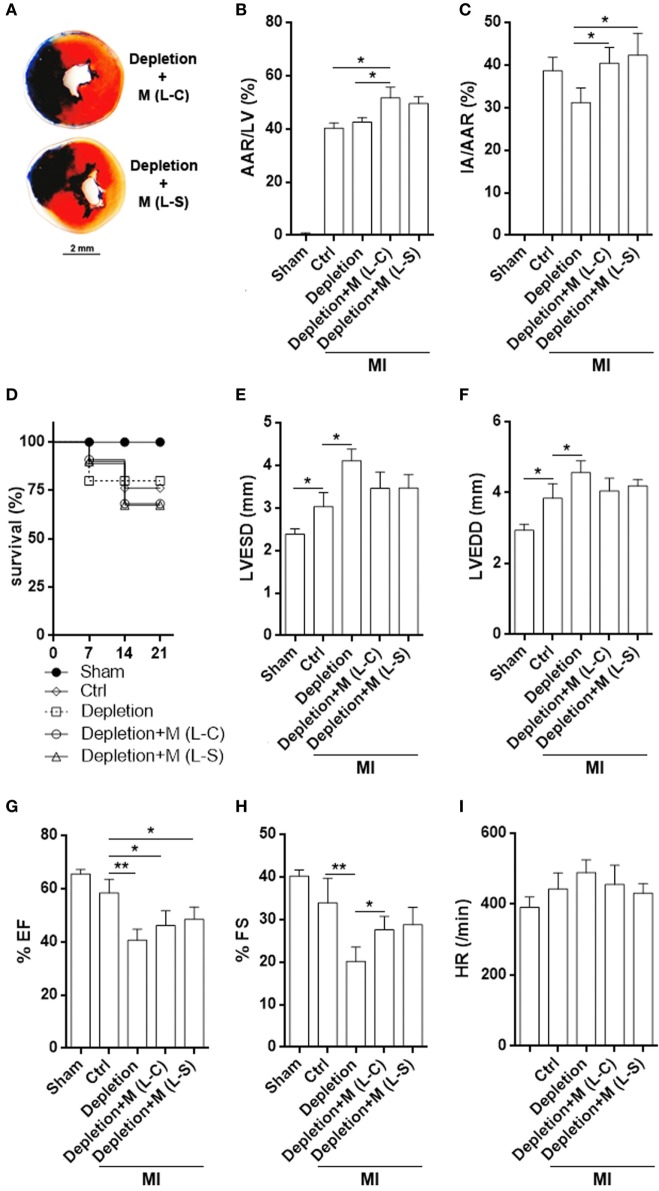
Infarct size and left ventricle function after myocardial infarction (MI). (A) Representative triphenyltetrazolium chloride staining image. (B,C) Measurement of area at risk and infarct area. Ctrl: un-pretreated mice. Depletion: Clophosome® injection. Depletion + M (L-C): Clophosome® injection followed by transfer of M1 macrophages transduced with control lentivirus. Depletion + M (L-S): Clophosome® injection followed by transfer of M1 macrophages transduced with SESN2 lentiviral activation particles. AAR/LV: area at risk volume relative to left ventricle volume. IA/AAR: infarct area relative to area at risk. N = 6 per group. (D) Mouse survival after MI. (E–I) Evaluation of left ventricle end-systolic diameter (LVESD), LVEDD, FS, ejection fraction (EF), and heart rate by echocardiography 2 weeks after MI. N = 5–6 per group. *p < 0.05; **p < 0.01.

