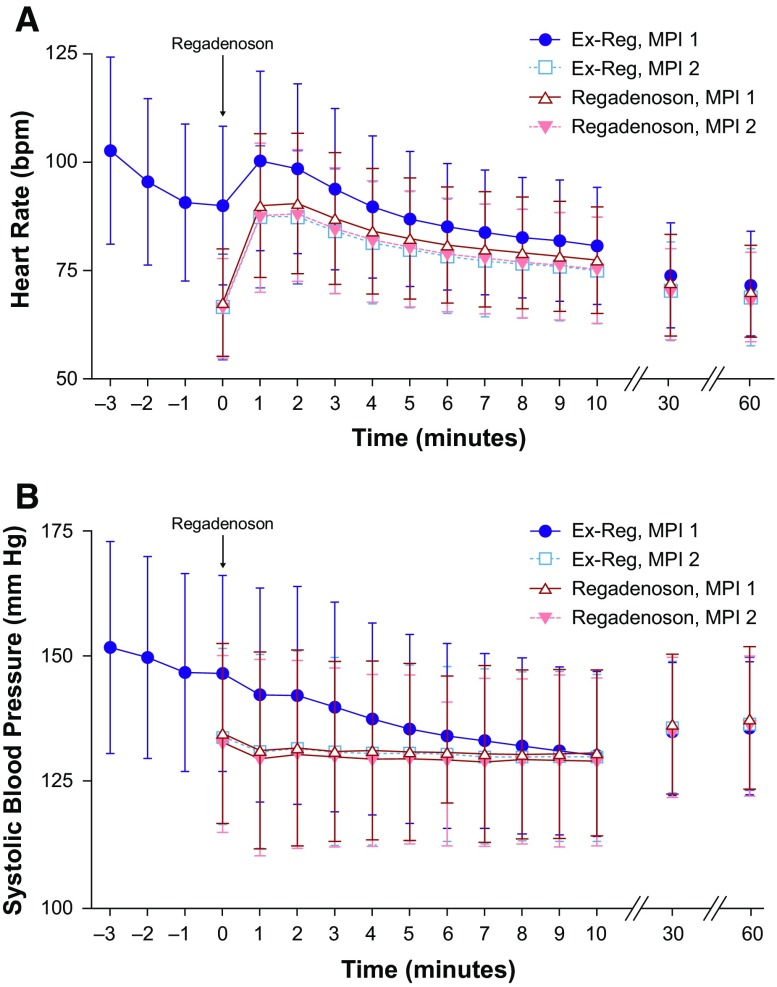
Figure 4.
Responses for heart rate (A) and systolic blood pressure (B). Illustration of the mean and SD changes in heart rates (A) and systolic blood pressure (B) over 60 minutes in Ex-Reg and Regadenoson during the first and second stress MPI procedures. MPI, Myocardial perfusion imaging; SD, standard deviation

