
FIGURE 2.
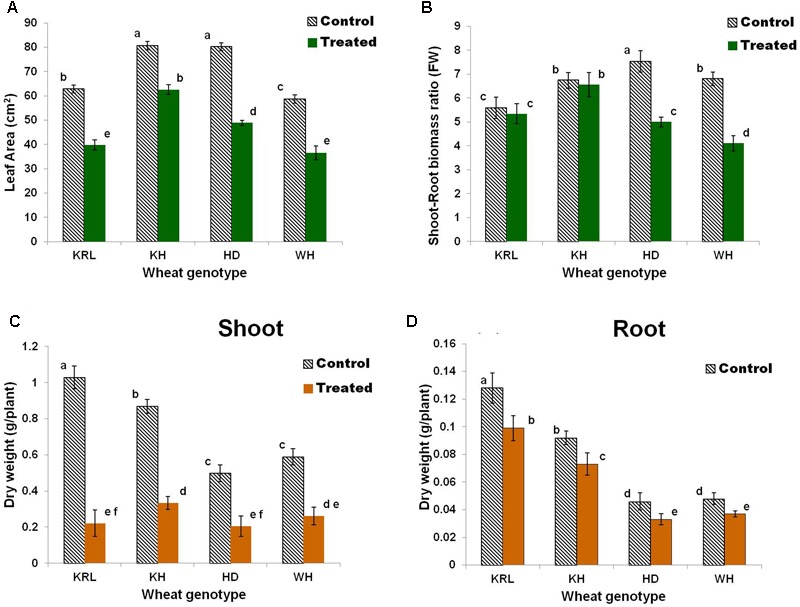
Effects of salt stress on bread wheat genotypes. Leaf-area (A), shoot-root biomass ratio (B), dry weight of shoot (C), and dry weight of root (D). Two-week-old seedlings were treated with 200 mM NaCl for 14 days. KRL = KRL-210, KH = Kharchia-65, HD = HD-2329, and WH = WH-542. Bars indicate ± SD. Columns with different lower case letters indicate significant difference at P < 0.05 [Fisher’s least significant difference (LSD) test].