
FIGURE 3.
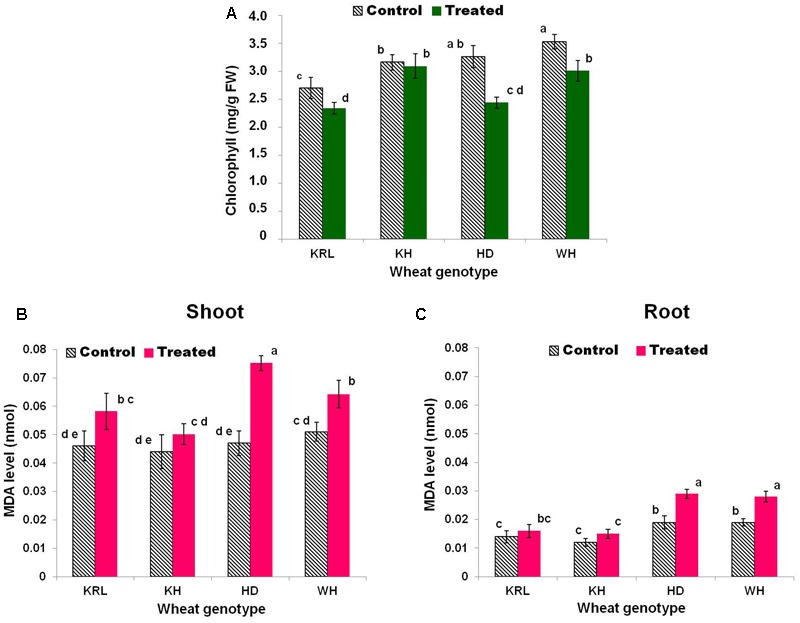
Effects of salt stress on total chlorophyll content (A), malondialdehyde (MDA) level (lipid peroxidation) in shoot (B), and MDA level in root (C) in the wheat genotypes. Two-week-old seedlings were treated with 200 mM NaCl for 14 days. KRL = KRL-210, KH = Kharchia-65, HD = HD-2329, and WH = WH-542. Bars indicate ± SD. Columns with different lower case letters indicate significant difference at P < 0.05 (Fisher’s LSD test).