
FIGURE 7.
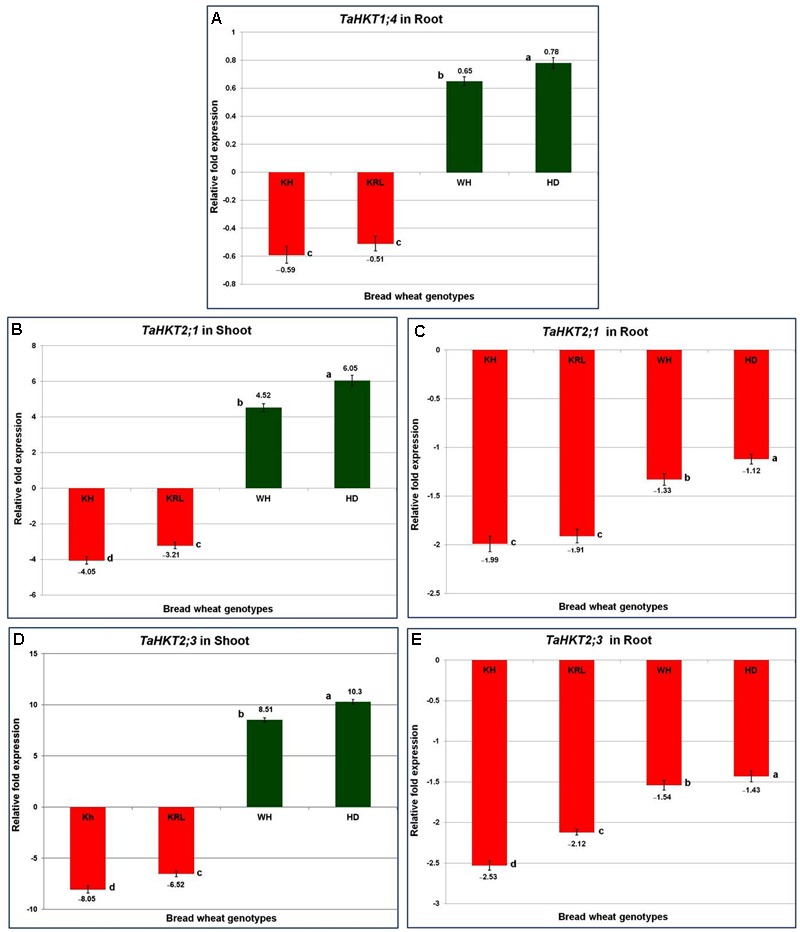
Quantitative expression (RT-qPCR) analysis of salt-responsive high-affinity potassium transporter (HKT) genes. Transcript accumulation of TaHKT1;4 in root (A), TaHKT2;1 in shoot (B), TaHKT2;1 in root (C), TaHKT2;3 in shoot (D), and TaHKT2;3 in root (E). Two-week-old seedlings were treated with 200 mM NaCl for 14 days. KRL = KRL-210, KH = Kharchia-65, HD = HD-2329, and WH = WH-542. The results are mean fold change in relative expression over the control with three biological and three technical replicates, normalized with actin (reference) gene expression. Bars represent standard deviation. Columns with different lower case letters indicate significant difference at P < 0.05 (Fisher’s LSD test).