
Figure 1.
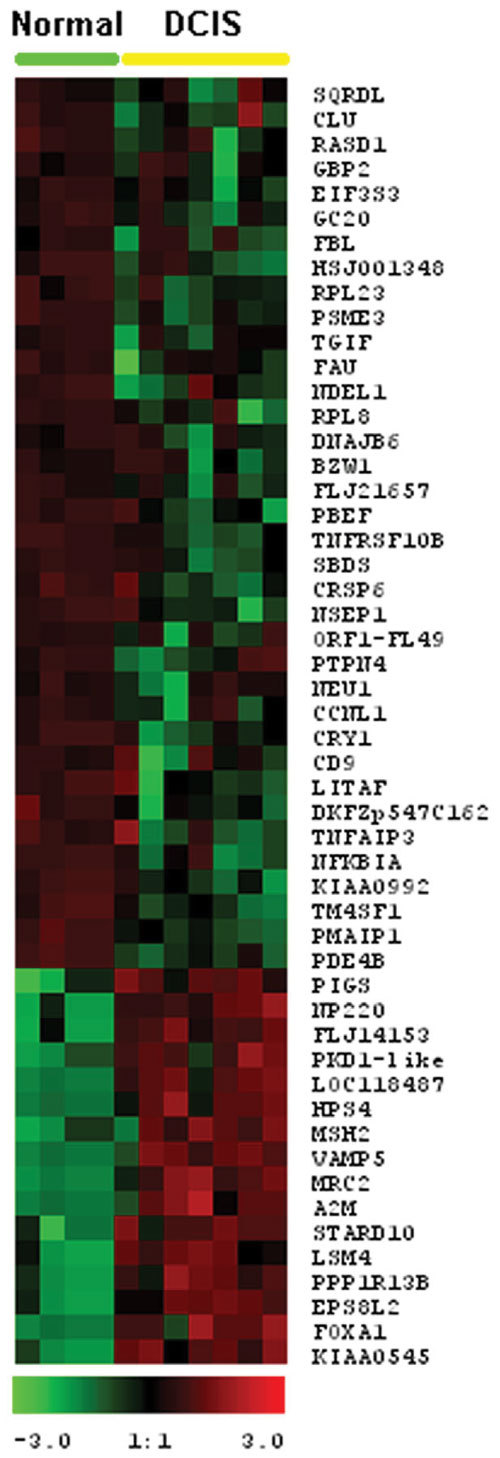
Hierarchical clustering of the most commonly different expressed genes between normal breast tissue and ductal carcinoma in situ (DCIS) groups (P < 0.01). Color scale at bottom of picture is used to represent expression level: low expression is represented by green, and high expression is represented by red.