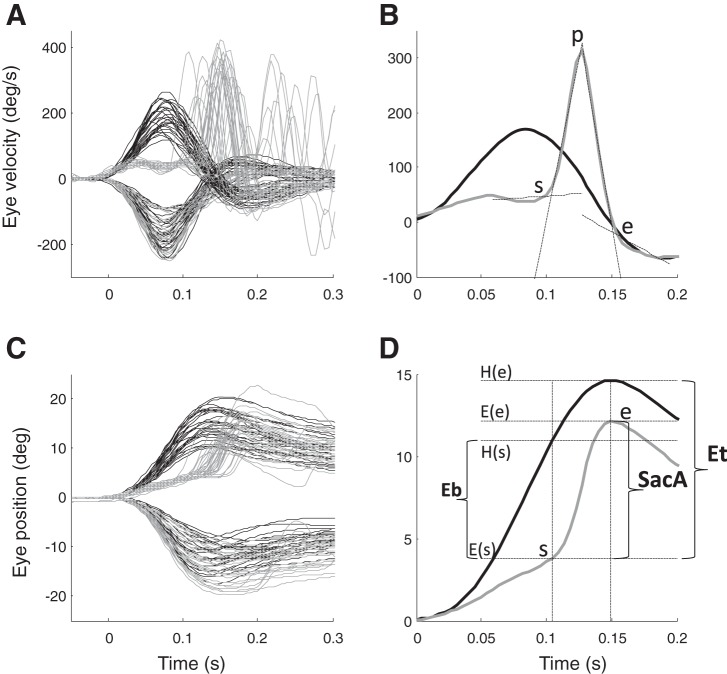
Fig. 1.
A: head velocity (black line), and inverted eye velocity (gray line) profiles of repetitive head turns toward the ipsilateral and contralateral side in a representative patient. B: head velocity (black line), and inverted eye velocity (gray line) in one of the impulses shown in A toward the affected side: s = start, p = peak velocity, e = end of saccade. s and e are initially computed on the high-pass filtered velocity to eliminate the slow-phase component. They are then refined based on the unfiltered signal as the intersection between the linear fit of the 45 ms before s and the linear fit between s and p and as the intersection between the linear fit of the 45 ms after e and the linear fit between p and e (black dotted lines). C: head position (black line) and inverted eye position (gray line) profiles of repetitive head turns toward the ipsilateral and contralateral side for the same patient are shown in A. D: head position (black line), and inverted eye position (gray line). Eb represents the error at the beginning of the saccade, while Et represents the total error that the saccade has to compensate to reach the 0° gaze position. SacA is the saccade amplitude.

