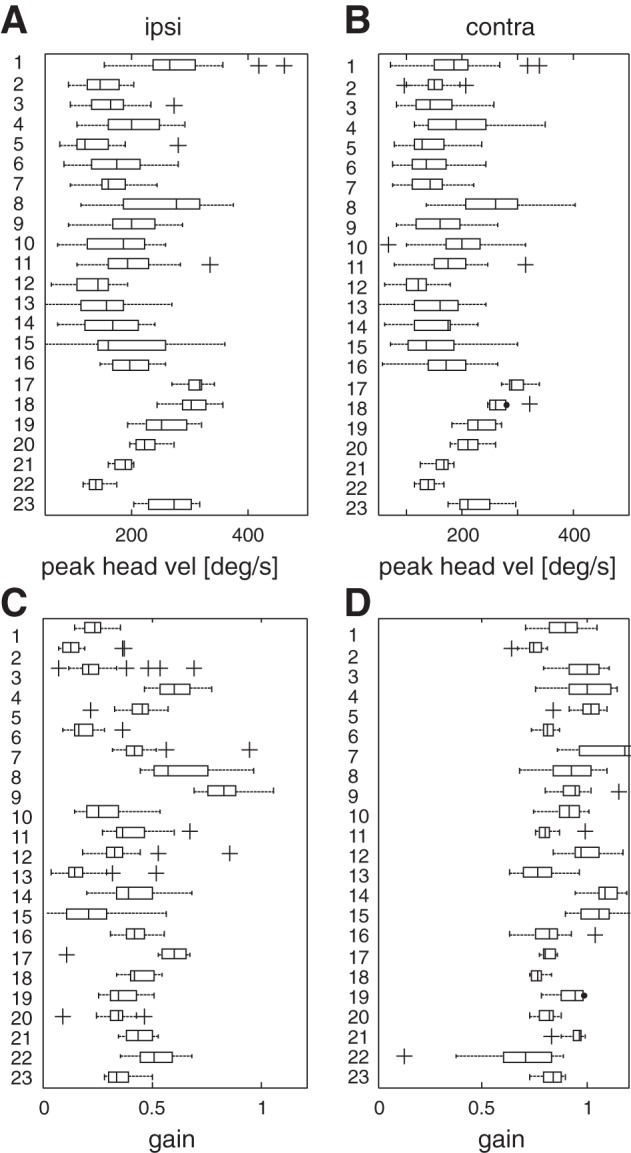
Fig. 3.

A and B: peak head velocity values for each subject for ipsilateral (ipsi) and contralateral (contra) head impulses. Peak head velocity correlates with peak head acceleration (ρ = 0.89). The range of peak head velocity is 50–400°/s while for peak head acceleration the range is 1,000–8,000°/s2. C and D: VOR gains for each subject for ipsilateral and contralateral head impulses. In each box, the central mark is the median, the edges are the 25th and 75th percentiles, the whiskers extend to the most extreme data points not considered outliers, and outliers are plotted individually as crosses.
